


Thrill Casino Review 2026: Is it legit? Licensed in Anjouan, every withdrawal fee published
Thrill is a crypto casino and sportsbook licensed in Anjouan, and the regulator’s register confirms it. Thrill publishes every withdrawal fee, its 1x rollover rule and all 16 VIP levels. It has no deposit limits and names no ADR body. Its public bet feed pays out 168.09% of stake, so it can’t be a full record of play. Our real-money tests are coming soon.


 +4
+4- Any time, no threshold
- All 26 pairs published
- Not published
- 13 territories
168.09% paid back
of the stake on 1,206,859 captured bets
Sep 16–23, 2026 · a feed ratio, not a game’s RTP
21 sections
Thrill FAQ: what people ask, answered up front
Is Thrill legit and safe?
Yes, Thrill is licensed. The Anjouan public register lists ALSI-202506019-FI1 for Gravity Unleashed Limitada, valid to June 18, 2027. Thrill names no ADR body and offers no deposit limits.
See the register entry →Who owns Thrill?
Thrill is run by Gravity Unleashed Limitada (Costa Rica company number 3-102-923055) under Anjouan license ALSI-202506019-FI1. Thrill names no directors or beneficial owners, and Costa Rica itself doesn’t license online gambling.
See the operator record →Does Thrill have a Curaçao license too?
No license number backs it up. Thrill’s help center says it holds two, Curaçao and Anjouan, but the Terms, the privacy policy and every footer name only Anjouan. No Curaçao license number appears anywhere.
See both readings →Is Thrill available in the US, the UK or Australia?
No for the US and the UK, which Thrill’s Terms, help center and Anjouan license all exclude. Australia is on the help center’s list and the license’s but not in the Terms. Spain is only on the license’s, and the regulator won’t hear complaints from either.
Compare the lists →Can I use a VPN with Thrill?
No, not to get into a blocked country. That breaches the Terms, and a breach lets Thrill void bets, withhold funds and close the account. From a restricted region, you may still log in and withdraw, but not register, deposit or play.
See the VPN clause →Does Thrill require KYC?
Yes. Your email and account must be verified before any deposit, and Thrill can ask for ID at any time (Terms §4.1) with no threshold. There’s no verification article in the help center and no published review time.
See the KYC steps →What has to happen before I can withdraw from Thrill?
You have to wager each deposit once (Terms §5.7). Thrill decides afterwards whether your bets counted as “meaningful gameplay”, and no game weighting table is published, so no game is known to clear it faster.
See the rollover rule →Does Thrill charge withdrawal fees?
Yes, and Thrill publishes every fee, one per network and token pair, 26 in all. The chain you pick changes the cost by up to 100x. Each coin’s minimum is tied to its fee, the help center sets no maximum, and no processing time is published.
See the fee table →Is there a minimum deposit at Thrill?
No. Thrill sets no minimum and no maximum deposit. There’s no deposit limit tool either, although the Anjouan license Thrill links to requires one.
See the player controls →How does Thrill’s VIP ladder work?
Thrill’s VIP ladder has 16 levels, from Base to Obsidian, with every XP threshold published. Level-up bonuses run from $15 at Bronze to $12,800 at Diamond I. Above that, they “will be left as a surprise”. 13 levels showed up in the feed in our week.
See the XP ladder →What bonuses does Thrill offer?
Thrill offers level-up bonuses, reloads at Platinum I, II and III, and weekly and monthly bonuses based on your VIP rank and wagering. None is credited automatically. Claim each one inside its window or it expires.
See the reward rules →What is Thrill’s rakeback percentage?
Thrill doesn’t publish one, at any level. It defines rakeback as a percentage of the house edge on your bets and never says what percentage. The weekly bonus uses your rank, your 7-day wager and the games’ house edge, with no weighting published.
See what isn’t published →When do I get a VIP host at Thrill?
From Emerald I. From then on, your host handles your bonuses instead of support, so the person who decides whether a bonus counts is the one assigned to keep you playing. 115 usernames showed up at that tier in our week.
See the observed tiers →Thrill’s bet feed shows players winning. Is that real?
Not as a full record. The feed pays out 168.09% of stake over 1,206,860 settled bets, and more than it takes in 166 of 168 hours and both halves of the catalog. Thrill’s own Dice settles at 151.46% over 252,121 rounds, which fixed math can’t do.
See every slice we cut →Is that number Thrill’s RTP?
No. It’s a feed ratio for one capture, not a game’s RTP. A public feed shows the bets it chooses to show, and our snapshot records its completeness as “unknown”.
See what the feed can’t show →What games do people play most on Thrill?
Mostly Thrill’s own games. Its 13 in-house titles took 70.38% of bets and 62.28% of stake. Everything else comes from 47 outside studios and 2,023 game entries.
See the games →Are my bets public on Thrill?
Yes, whenever your username is attached, and you can’t hide it. 66.74% of bets in the feed carried one, 4,882 names in a week, each next to a stake, a game and a VIP tier.
See what the feed shows →How do I complain to Thrill if something goes wrong?
Start with support, then email complaints@thrill.com, then use the Google Form. Anjouan requires every licensee to use an approved ADR provider and pay for it. Thrill names none, sets no deadline of its own and caps its liability at what you deposited.
See the complaint route →
Thrill at a glance
Gravity Unleashed Limitada, a Costa Rican company, runs Thrill under Anjouan license ALSI-202506019-FI1. The regulator’s public register lists the same number, company and domain. Thrill publishes more of its rules than most crypto casinos:
- Withdrawal fees for all 26 network and token pairs
- A 1x wagering rule on each deposit before a cashout
- The exact XP cost of every VIP level
Player protection is thin at Thrill. There are no deposit limits, self-exclusion only goes through support, and no ADR body is named, although the regulator requires one.
Thrill’s public feed shows 1,206,860 settled bets paying out 168.09% of stake. Its own Dice settled at 151.46% over 252,121 rounds. A fixed-math house game can’t settle there over that many rounds, so the feed can’t be showing every bet.
- Anjouan Gaming Authority, Autonomous Island of Anjouan, Union of Comoros
- ALSI-202506019-FI1
- Gravity Unleashed Limitada · Costa Rica company number 3-102-923055
- 13 territories
- Oct 4, 2026
- 1,206,860
- Sep 16–23, 2026
- 168 hours
- +6
Thrill screenshots: the logged-out lobby on desktop and mobile
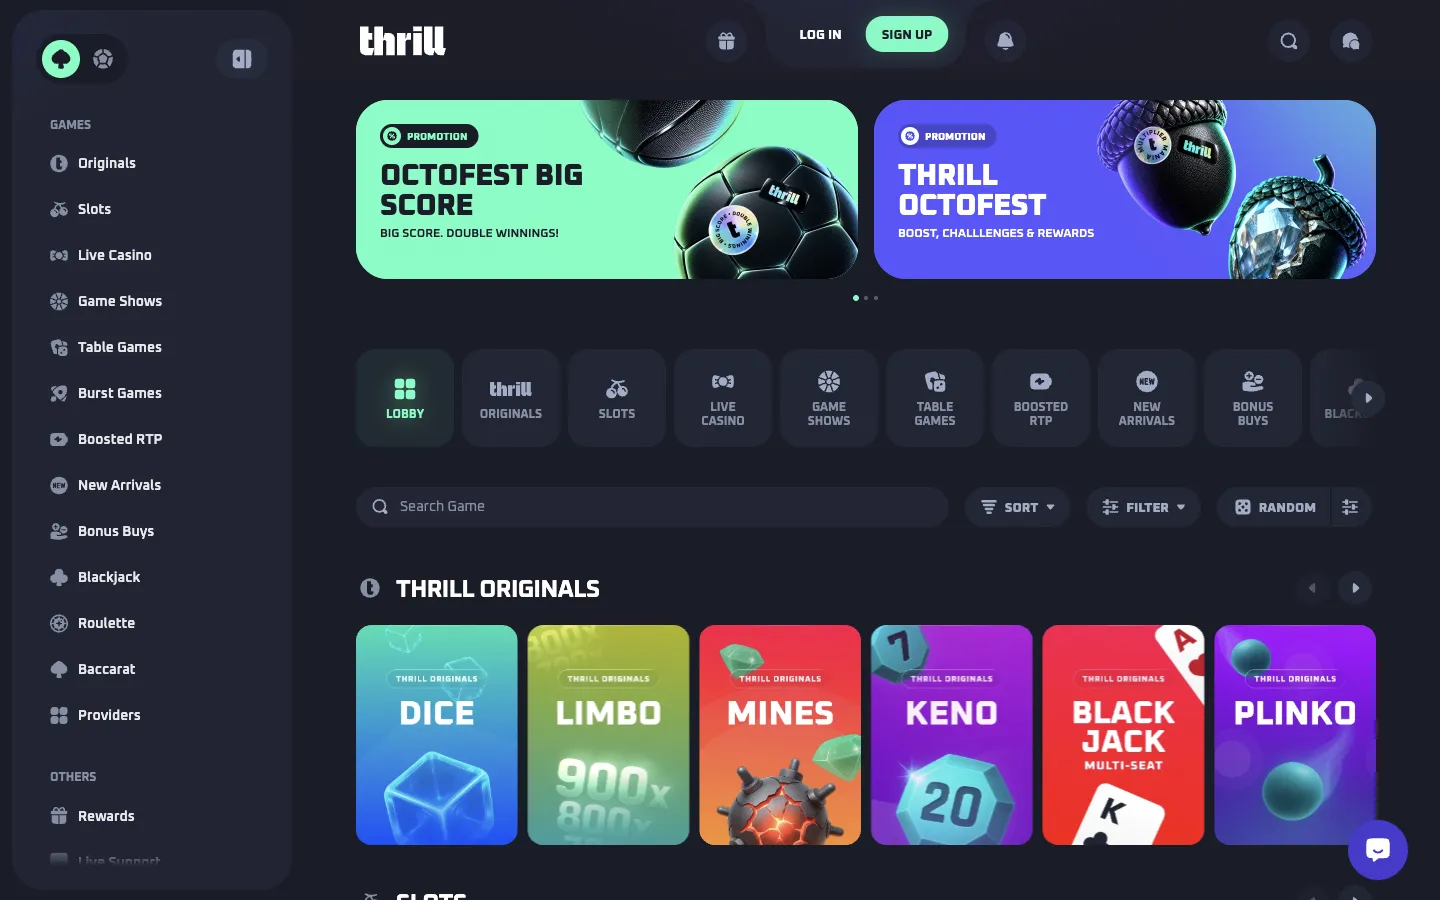
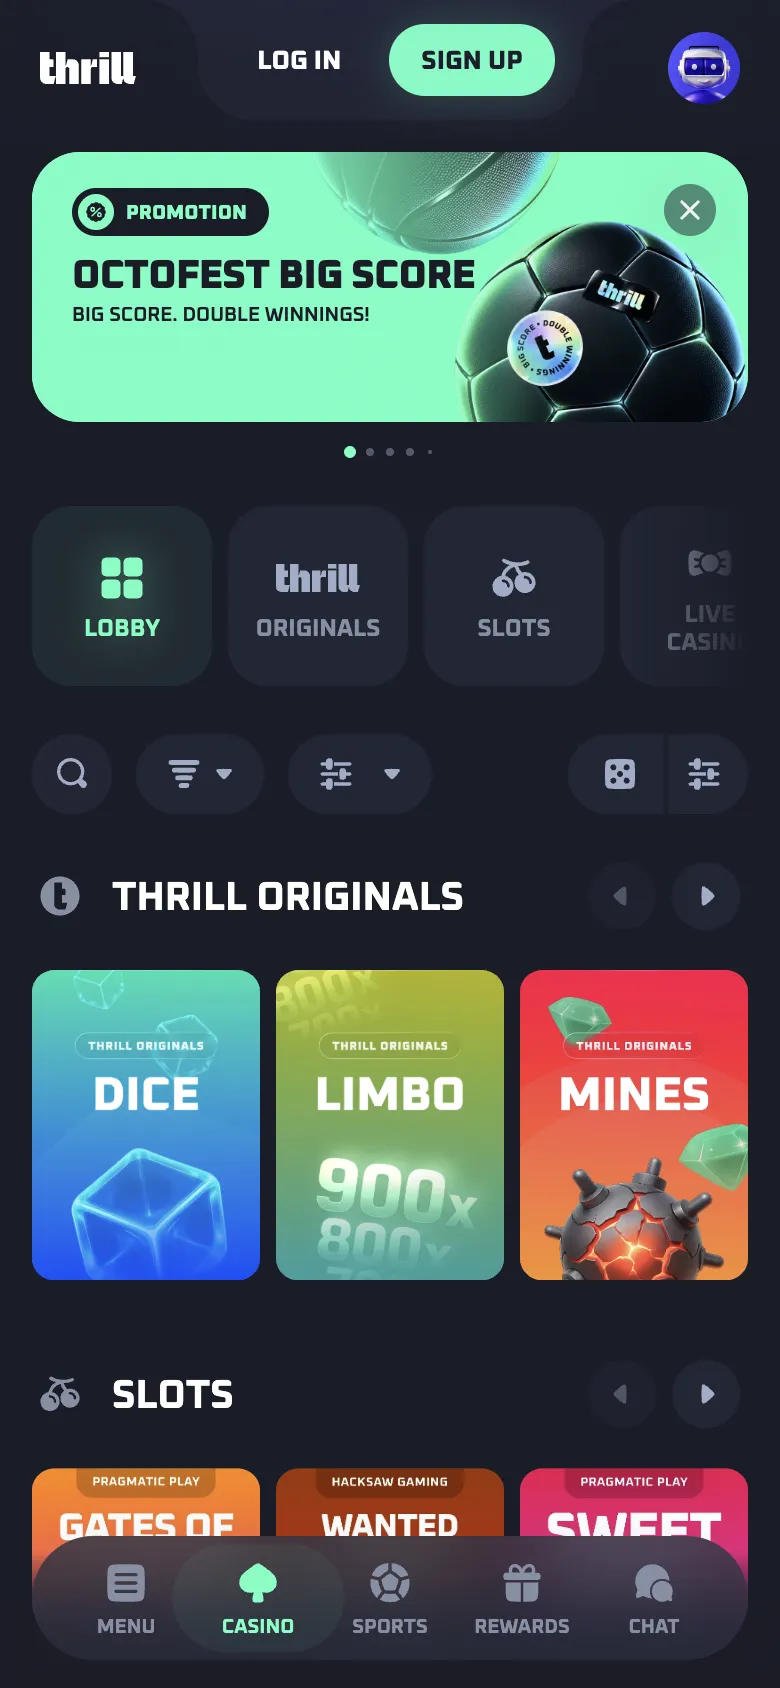
thrill.com, logged out, Oct 3, 2026.
Thrill pros and cons
Pros
- License ALSI-202506019-FI1 on the Anjouan public register, valid to June 18, 2027
- Every withdrawal fee published, for all 26 network and token pairs
- No max withdrawal in the help center
- All 16 VIP levels published with exact XP thresholds and XP rates
- Rollover rule written into the contract (Terms §5.7)
- The 13 Originals in the feed are exactly the 13 Thrill lists
Cons
- The public bet feed pays out 168.09% of stake, so it can’t be a full record of play
- Three exclusion lists that disagree (8 territories in the Terms, 12 in the help center, 7 on the license)
- A dormant account can lose 5% of its balance every month (Terms §6.2)
- No deposit, loss, wager or time-out limits, although the license requires deposit limits
- No ADR body named, although Anjouan requires one at the casino’s cost
- No rakeback percentage, and no level-up bonus published above Diamond I
- Usernames are public in the bet feed and can’t be hidden
What to check before you deposit at Thrill
1Can you trust the bet feed on Thrill’s front page?
No. It pays out 168.09% of stake
Across 1,206,860 settled bets, the feed pays out more than it takes in 166 of 168 capture hours, all 6 stake bands and both halves of the catalog. A complete record of play couldn’t do that.
See the evidence →Treat the live feed as a display, not as proof the games pay.
2Does Thrill accept players where you live?
Three lists, and they disagree
Thrill’s Terms block 8 territories and its help center 12. The license its own footer links to excludes 7, including Spain, which neither Thrill list names.
See the evidence →Check every list and your local law before you sign up.
3What has to happen before you can withdraw?
Wager each deposit once
Every deposit needs 1x wagering before you can request a cashout (Terms §5.7), and Thrill can void bets it decides aren’t “meaningful gameplay”. No game weighting table is published.
See the evidence →Count every deposit as locked until you’ve wagered it once in full.
4Can you cap what you deposit?
No limit tools at all
No deposit, loss, wager or time-out limits, although the license requires deposit limits. Self-exclusion runs 1 to 180 days, and only through live chat or support@thrill.com.
See the evidence →Set your budget in your own wallet. Thrill gives you no tool for it.
How we checked Thrill
These are the checks behind this review, each with its date. The numbers come from Thrill’s public bet feed and the rules from its own documents. Our method
- License checked at the regulator
Operator name, number, type and domain all match the register, and the validator agrees. One help center article also claims a second license, which appears in no other Thrill document and on no register we checked.
- Operator documents read
25 documents from Thrill’s terms, help center and policies, each one linked under Sources.
- Public bet feed captured
1,206,860 bets over 168 hours, Sep 16–23, 2026. Source: Public feed · USD-priced bets.
Coming soon
We haven’t deposited at Thrill yet. Each result will land here with its date and how long it took.
- Deposit
How long a crypto deposit takes to credit, on two networks.
- Withdrawal
How long a withdrawal takes to reach our wallet, and every fee on the way.
- Support chat
How fast a human replies in live chat, and whether the answer matches the terms.
- KYC check
What the casino asks for, when it asks, and how long approval takes.
Thrill score: 8.0 out of 10
- License9.4Answered: how the license was checked, license number match, license holder, issue and expiry dates and licensed domains. Conflicting or only pointed at: licensing authority.
- Withdrawals7.3Answered: withdrawal fee, minimum withdrawal, withdrawal limit, withdrawal coins, payout networks and deposit playthrough. Not published: processing time and confirmations.
- KYC8.8Answered: what the terms require, when KYC is triggered, accepted documents, limits during a check and if you don’t verify. Not published: verification time.
- Complaints & self-exclusion7.5Answered: where a complaint starts, escalation route, what the regulator says and self-exclusion. Not published: complaint deadlines and named ADR body.
- Restricted countries9.3Answered: restricted countries, second list, whether the list is complete, what the license covers, what happens to the account, using a VPN and how location is checked. Conflicting or only pointed at: game provider blocks.
- Bonus terms3.6Answered: bonus offer and forfeiture rules. Conflicting or only pointed at: wagering requirement and bonus expiry. Not published: rakeback or reward rate, game contribution, max bet while wagering and max cashout.
- Public bet feed10.0The feed shows losing bets as well as wins, in dollars, so its totals can be checked.
Overall
8.0
Weighted from Thrill’s own documents, its license record and its public feed. How we score
Thrill restricted countries: where can’t you play?
Three lists that disagreeThrill’s Terms block 8 territories, and its help center now lists 12. The Anjouan license validator, linked from Thrill’s own footer, excludes 7. No two of the three lists match. These are Thrill’s and its regulator’s lists, not legal advice.
Thrill in Australia, France and Spain
Australia, France and Spain are on the license’s list but not in the Terms. The help center’s list blocks Australia and France, while Spain sits on neither Thrill list. The regulator says complaints from all three “fall entirely outside the regulatory scope of the Anjouan Internet Gaming License and will not be entertained”.
- Thrill’s Terms (§11.4): 8 territories. First on the list is Anjouan, the island that issued the license.
- The help center’s list: 12 territories. It adds Australia, France, Germany, Iran and North Korea, and it drops Anjouan.
- The license validator: 7 territories. Plus every FATF-blacklisted and sanctioned country. Thrill may still take the account, but the regulator won’t take the complaint.
- The catch-all: Open-ended. The clause ends with “any other location where the use of the Services is prohibited”, so the eight names are the minimum.
A country missing from both lists can still fall under the open-ended clause.
Can you use a VPN at Thrill?
Not to get around the block. Using a VPN or proxy that way breaches the Terms (§11.4), and a breach lets Thrill void bets, withhold funds and close the account.
Restricted countries list
Thrill doesn’t accept players from these 13 territories.
- Anjouan
- British Virgin Islands
- Curaçao
- The Dutch Caribbean Islands
- Cyprus
- Netherlands
- United Kingdom
- United States
- Australia
- France
- Germany
- Iran
- North Korea
Who owns Thrill, and is its license real?
Confirmed on the registerGravity Unleashed Limitada (Costa Rica company number 3-102-923055) runs Thrill under Anjouan license ALSI-202506019-FI1. The regulator’s public register confirms it. On October 4, 2026, it returned one row with the same company, number and domain (thrill.com), type B2C and status Valid, issued June 19, 2025 and expiring June 18, 2027. Open the public register entry
Costa Rica doesn’t license online gambling, so the company and the license sit in two jurisdictions, and most players live in neither.
Does Thrill have a Curaçao license?
Only Thrill’s help center says so. Its “About Thrill” article says Thrill “operates under two recognized gaming licenses: A Curaçao eGaming license, and An Anjouan Gaming license”. The Terms, the privacy policy, the AML and anti-fraud policies and every footer name only Anjouan. No Curaçao license number appears anywhere, and a Curaçao register search turns up nothing for this operator. Read the help center claim
Thrill ownership: still to verify
- Second license (Curaçao): Claimed in the help center, no number published
- Directors: Not named in Thrill’s documents
- Beneficial owners: Not named in Thrill’s documents
- Gravity Unleashed Limitada
- Costa Rica company number 3-102-923055
- Barrio Dent, San Pedro, Ofident Building, Office 3, San Jose, Montes de Oca, Costa Rica
- ALSI-202506019-FI1
- Anjouan Gaming Authority, Autonomous Island of Anjouan, Union of Comoros
- B2C, under the Computer Gaming Licensing Act No. 007 of 2005
- Valid. Issued June 19, 2025, expires June 18, 2027
- thrill.com
License
- Anjouan Gaming Authority, Autonomous Island of Anjouan, Union of Comoros
- ALSI-202506019-FI1
- Gravity Unleashed Limitada · Costa Rica company number 3-102-923055
- Checked at regulator
Thrill KYC: when can Thrill ask for your ID?
Published rulesThrill can ask for ID at any time (Terms §4.1), with no threshold, and it can suspend your account until the documents arrive. The help center has no verification article, so KYC lives in the Terms and the AML policy. The only published number is in the anti-fraud policy, which reports transactions above USD 10,000.
Thrill AML checks
Thrill screens you against sanctions and PEP lists, geo-blocks by IP and runs every crypto deposit and withdrawal through Chainalysis. One account per person, and linked accounts are checked on device, IP, network and payment data (Terms §3.4). Read Thrill’s AML policy
- Not published
- The only number: transactions above USD 10,000 get reported (anti-fraud policy)
- Not published
- A withdrawal “may be suspended once it reaches a withdrawal threshold”
- Not published
- Not documented
1Before you deposit
18+, or your local age of majority if higher (Terms §3.1)
Your email and account must be verified before your first deposit. The help center documents no two-factor authentication.
2If Thrill asks
Any time, no published threshold
ID documents to confirm your identity, age and location (Terms §4.1). The account can be suspended until they arrive.
3What gets collected
Full identity, address and source of funds
Full name, home address, date of birth, place of birth, nationality, an ID number and contact details (AML Policy §5a). Low-risk accounts may only need the first three. Enhanced checks add proof of address, ID copies and source of funds, verified directly or through third parties (§5e).
4If you can’t comply
Suspension, closure, forfeiture
Missing or forged documents, or trying to get around verification, can get the account suspended or closed, with “the forfeiture of all the funds held in it, to the extent permitted by Law” (Terms §4.3).
Thrill withdrawals: what does a cashout cost?
Withdrawal test coming soonThrill charges its own withdrawal fees and publishes every one, for 26 network and token pairs. The help center sets no max withdrawal, though Terms §5.4 lets Thrill set limits. Before any cashout, each deposit needs 1x wagering (Terms §5.7), and Thrill decides whether your bets counted.
Thrill wagering requirement on deposits
Thrill judges the 1x rollover after the fact. Bets that look placed only to clear it can be voided, such as opposite bets, low-risk patterns or anything “that does not constitute meaningful gameplay”. No game weighting table or worked example is published, so Thrill decides what counts after you’ve played.
Thrill withdrawal fees by network
The same USDT withdrawal costs 1 USDT on Ethereum or Tron and 0.5 USDT on Solana. USDC costs 1 on Ethereum, 0.1 on Polygon and 0.01 on Arbitrum. That’s up to 100x between networks. Each coin’s minimum withdrawal is tied to its fee, so you can’t withdraw less than the fee.
Thrill dormant accounts
Since the September 16, 2026 Terms, an account inactive for 12 months can be frozen and charged 5% of its remaining balance every month, and a balance under $5 can be taken whole (§6.2). Withdraw what you don’t plan to play.
What Thrill’s cashier doesn’t publish
- A processing time
- A deposit confirmation count
- A game weighting table for the rollover
- The balance at which withdrawals “may be suspended”
Thrill coins in the feed
Two settlement codes in the feed aren’t on Thrill’s supported-cryptocurrency page. 1,060 bets settled in CAD and USD, 0.09% of the 1,206,860 bets in the window, and we can’t say what they are.
Our real-money tests are coming soon.
- 1x each deposit
- Wagered in full before a withdrawal request goes through
- None
- No minimum or maximum deposit for any coin
- Not published
- Only typical blockchain arrival times, no processing time
- Paid by you
- Your wallet or exchange may charge its own on top (Terms §5.2, §5.3)
- Tied to the fee
- Varies by coin. You can’t withdraw less than that coin’s withdrawal fee
Thrill coins in the feed by share of USD stake
Thrill lists 15 deposit coins across 11 networks. The feed showed 17 settlement codes. Native amounts are never added across codes, so only the USD column compares.
Thrill VIP levels, bonuses and rakeback: what does the XP ladder get you?
Full ladder, no rakeback rateThrill publishes all 16 VIP levels with exact XP thresholds and XP rates. Level-up bonuses are published only up to Diamond I, and no rakeback percentage is published at all. In a full week of the feed, players showed up at 13 of the 16 levels.
How Thrill XP works
Casino games earn 1.5 XP per $1 at 97% RTP or below, 1 XP between 97% and 99%, and 0.5 XP above 99%. Sports bets earn 3 XP per $1 at odds of 1.10 or above, and 1 XP below that.
Thrill level-up bonuses
Level-up bonuses run from Bronze ($15) to Diamond I ($12,800). Above Diamond I, where the amounts get large, they “will be left as a surprise”.
Thrill VIP levels in the bet feed
13 of the 16 levels showed up in 1,206,860 bets. Diamond III, Diamond V and Obsidian never did. Thrill stamps a tier on every bet it shows with a username, so the published ladder and the real one line up directly. The top is nearly empty. In a full week, 2 usernames showed up at Diamond IV, and none above it.
What it costs to reach the top at Thrill
Diamond IV, the highest tier anyone reached in our week, needs 250,000,000 XP. That’s $166.7M wagered at the casino rate of 1.5 XP per $1, or $83.3M at the sports rate of 3 XP per $1. Obsidian needs 1,000,000,000 XP, or $666.7M at the casino rate and $333.3M at the sports rate.
Thrill rakeback and weekly bonus
Thrill pays rakeback as a percentage of the house edge, win or lose, inside its other bonuses. The percentage is never stated, so you can’t value a week of play in advance. The weekly bonus uses your VIP rank and “the house edge of the games you play” as inputs, with no weighting published.
- Rakeback percentage: Not published for any level
- Weekly and monthly bonus formula: No formula, coefficient or worked example
- Level-up bonuses above Diamond I: “Left as a surprise”
- Bonus disputes: Thrill’s decision is final (Terms §9.6)
Bonuses aren’t credited automatically. Claim each one inside its window or it expires. If the account is closed, every unclaimed or pending reward is forfeited (Terms §19.3).
Top of Thrill’s VIP ladder: XP, level-up bonus and whether the feed showed each level
Starts at Diamond I, the last level with a published level-up bonus. All 16 levels are in Thrill’s rewards levels article.
Thrill games: what gets played most?
Thrill’s own games get played most. Its 13 in-house titles took 70.38% of bets and 62.28% of stake. The other 47 studios brought 2,023 game entries. The feed flags every in-house round at the source, so the split is exact.
- One game’s share of the money: 20.21%. Blackjack (Thrill) took $1.3M on just 10,828 bets.
- The long tail: 1,986. Game entries outside the top 50 by stake, with 9.60% of stake over 233,419 bets.
By bet count, the order changes. Dice ran 252,121 rounds, 20.89% of the window, at an average bet of $2.94. Activity and money sit in different places, so we never rank games on one of them alone.
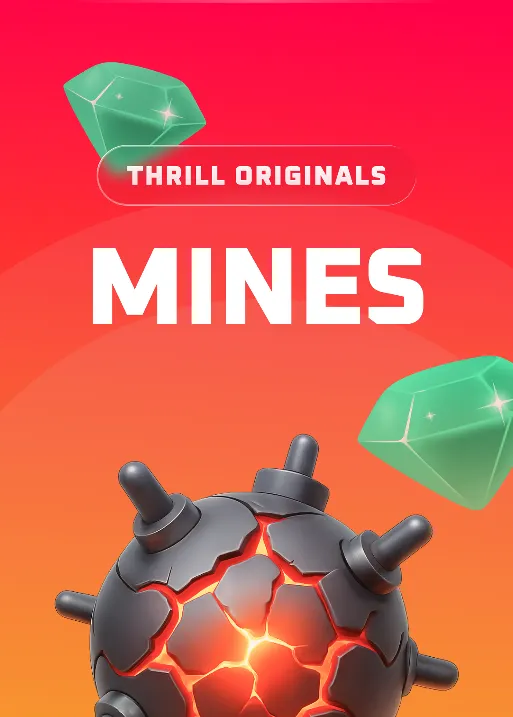
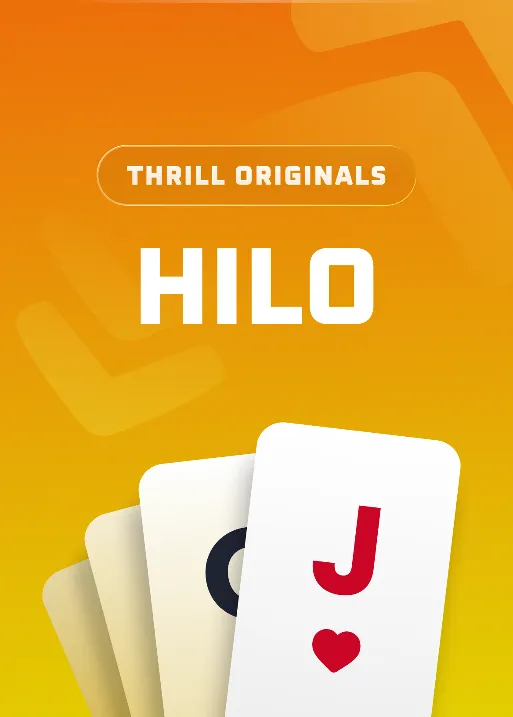
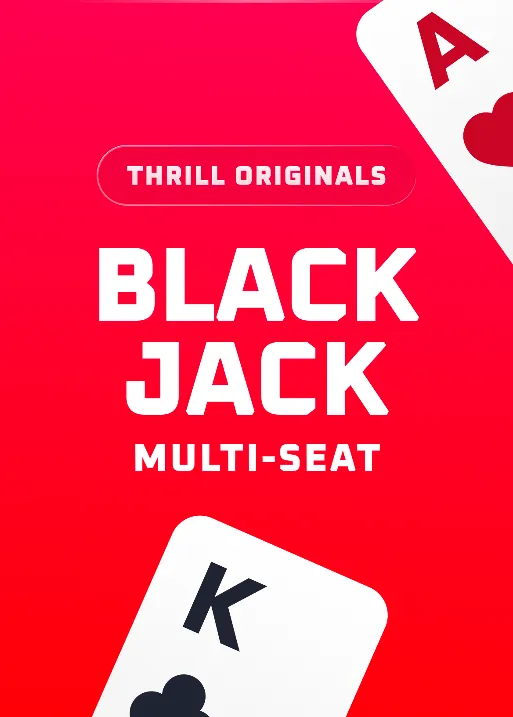
Thrill Originals
All 13 Originals in the feed are the 13 Thrill lists. Nothing in the feed is an unlisted house game, and no listed one sat idle all week. Max bet is $20,000 on most Originals, $25,000 on Crash, $150,000 on Roulette and $180,000 total across seats on Blackjack.
Six biggest of the 48 providers in the window by stake, Thrill’s own included






Thrill responsible gambling: what can you do to slow yourself down?
No deposit limitsThrill’s only responsible gambling tool is self-exclusion for 1 to 180 days, through support. There is no deposit, loss or wager limit, no time-out, no reality check and no permanent exclusion. The license Thrill links to requires deposit limits.
No deposit limits at Thrill
The Anjouan validator linked from Thrill’s footer says the operator “must … provide functional Responsible Gaming (RG) tools, including self-exclusion and deposit limit capabilities”. Thrill offers the first but not the second. Its deposit article says there is no minimum or maximum deposit for any coin.
How to self-exclude at Thrill
There’s no switch in account settings. You write to the same support channel that handles deposits, and the longest break is 180 days. It starts “as soon as reasonably practicable” (Terms §10.2), with no time given.
Anjouan’s self-exclusion form
The license validator linked from Thrill’s footer carries the regulator’s own self-exclusion form, with the permanent option Thrill lacks. You can pick a 2-day or 1-week cool-off, 1 to 6 months, 1 year or permanent. Anjouan shares that list only with operators on its platform. Open the regulator’s self-exclusion form
Is your Thrill username public?
Yes. Usernames are set at sign-up and can never be changed, and the help center says “We currently don’t offer the ability to hide usernames.” In the feed, 66.74% of settled bets carried one, 4,882 names in a week, each next to a stake, a game, a coin and a VIP tier.
Neither the privacy policy nor the username article tells you that your username, stake, game, coin and multiplier go to an open bet feed as each bet settles. We swap every username for a pseudonym before publishing anything. Even that isn’t anonymity, because an exact timestamp plus a stake is a fingerprint. Thrill shows the names as they are, and 805,408 of its published bets name a player and a tier together.
Thrill’s responsible gambling page links to BetBlocker, Gamban, Gambling Therapy and Gamblers Anonymous.
- 1 to 180 days
- Live chat or support@thrill.com
- No self-service control
- No set time
- Terms §10.2: “as soon as reasonably practicable”
- Locks the account
- Marketing stops for the chosen period
- None published
- Not published
Thrill’s player controls: what exists and what doesn’t
2 of these 8 controls exist. The responsible gambling policy is dated 1/1/2025, older than the Terms (16/09/2026).
Thrill complaints: what can you do if something goes wrong?
To complain at Thrill, start with live chat or support@thrill.com (24/7), then email complaints@thrill.com, then use the Google Form. Keep every transaction ID and timestamp. Anjouan requires every licensee to use an approved ADR provider, at its own cost, and Thrill names none.
The license validator linked from Thrill’s footer also carries the regulator’s own complaint form, for license breaches. Payout and account disputes go to Thrill first. Open the regulator’s complaint form
Thrill ADR: none named
The Anjouan Gaming Authority requires every licensee to use one or more approved ADR providers, to try to resolve a complaint within 30 days, and to pay for the ADR. The four it approves (EGIS ADR, Axion ADR, iGaming ADR and CADRE B.V.) appear nowhere in Thrill’s Terms, help center, complaint form or footer. You can’t know in advance which one would take a Thrill case.
Thrill complaints from Australia, France and Spain
There is no route at all. The regulator won’t hear complaints from its excluded territories. Those three countries are on its list but not in Thrill’s Terms, so the contract doesn’t turn you away, and no regulator will take your complaint. Open the license validator
Can you take Thrill to court?
Only in the courts of Anjouan, for no more than you deposited (Terms §20.2, §16.3). Suing a Costa Rican company with an Anjouan license there isn’t a realistic option for most players. Your real protection is small first deposits, an early test withdrawal and a copy of every message.
- 30 days
- Set by the regulator. Thrill’s Terms set none
- The casino
- A condition of the Anjouan license
- Thrill’s
- Terms §28.3: final “unless otherwise determined by an external adjudicator”
- The laws of the Autonomous Island of Anjouan, Union of Comoros (Terms §20.1)
- Exclusive jurisdiction of the courts of Anjouan, with no class or representative actions (Terms §20.2)
- Your total deposits (Terms §16.3)
- Coming soon
1Support
Live chat or support@thrill.com, 24/7
The same channel that handles deposits and bonuses. No response time is published, so log your own timestamps.
2Escalation to management
complaints@thrill.com (Terms §28.2)
It goes to the same company, one inbox further up.
3The complaint form
A Google Form linked from the footer
It asks for your name, email, date of birth, address, username, the date and time of the incident, the amount, whether you contacted support, a description and one of eleven categories. Google shows the form as created in a workspace named “Paradym”, not a thrill.com domain. Files have to be emailed separately to complaints@thrill.com.
4External review
No ADR body named
The regulator requires one and approves four. Thrill doesn’t say which it uses, so you have nowhere to write.
What does Thrill’s own public bet data show?
We captured 1,206,860 settled bets from 168 hours of Thrill’s public feed, all but one priced in USD. Payout came to 168.09% of stake. That’s a feed ratio, not a game’s RTP, and it says more about the feed than about the games.
Thrill feed payouts vs stake
Across 1,206,860 settled bets, Thrill’s public feed pays out 168.09% of what it takes in. Players staked $6,343,094, got $10,662,074 back and finished $4,318,980 ahead over 168 hours. All but one of the bets carry a USD stake and a USD payout. The one that doesn’t is left out of the dollar totals, so nothing is estimated.
Why Thrill’s feed can’t show every bet
A dice game can’t pay 151.46% over 252,121 rounds. Thrill’s house games run on fixed, provably fair math. Over hundreds of thousands of rounds, a complete record would settle close to each game’s own return. These settle far above it.
What the Thrill feed doesn’t tell you
We can’t see which bets make it into the public feed, and Thrill says nothing about what the feed contains or how complete it is. Our snapshot records its completeness as unknown. So you can’t use this feed to judge whether the games pay.
The Thrill feed pays out more than it takes in 176 of 178 slices
A hot streak would show up in one hour, one game or one bet size, and this doesn’t. Each row splits the same capture a different way.
- Capture hours: 71.19%–343.27%. 168 hours in the window. 2 settled at or below break-even.
- Every stake band: 145.94%–216.40%. From sub-dollar bets to the 726 bets of $1,000 or more. None of the six is below break-even.
- Originals and third-party games: 164.23% · 174.46%. Thrill’s own games and the 47 outside studios, counted separately.
- Named and hidden alike: 167.13% · 170.00%. Bets with a username and bets without one, counted separately.
- $6,343,094
- 1,206,859 priced bets, one unpriced
- $10,662,074
- Settled returns in the same window
- $4,318,980
- Net win for the captured players
- 168.09%
- Feed ratio for this capture only
Stake, payout and feed ratio for three Thrill Originals
- 1,206,860
- 168
- 168.09% paid back
- Sep 16–23, 2026
Thrill compared with similar casinos
All casinosSee how Thrill stacks up against similar casinos on score, license, restricted countries and bet data.
| Casino | Score | License | Restricted | Bets captured | Feed payout ratio |
|---|---|---|---|---|---|
| Thrill | 8.0 / 10 | Anjouan · checked | 13 territories | 1,206,860 | 168.09% |
 Rakebit Rakebit | 8.0 / 10 | Anjouan · checked | 13 territories | 172,609 | n/a |
 BC.Game BC.Game | 8.1 / 10 | Anjouan · checked | 27 territories | 581,645 | 93.95% |
 CoinCasino CoinCasino | 8.1 / 10 | Tobique · checked | 33 territories | 291,521 | n/a |
 Rainbet Rainbet | 7.9 / 10 | Anjouan · checked | 14 territories | 2,264,057 | n/a |
Our score
Is Thrill legit? Yes, with a register-confirmed license, published fees and no ADR body
Check both country lists before you sign up, and don’t judge the games by the live bet feed.
- What Thrill gets right: License, fee table, XP ladder. The register confirms the license, all 26 withdrawal fees are published, and all 16 levels list their exact XP cost.
- Data behind this review: 1,206,860 public bets. 2,036 game entries over 168 hours.
- Main concern: The feed can’t be a full record. It pays out 168.09% of stake, and more than it takes in 166 of 168 hours, all 6 stake bands, 43 of 48 providers and 16 of 17 settlement currencies.
- Still to test: Withdrawals and complaints. Our real-money tests are coming soon.
What could change this verdict
Four items are still open. Each is a test we haven’t run yet.
- Real-money withdrawal: Coming soon
- Account and KYC flow: Coming soon
- Self-exclusion request: Coming soon
- A filed complaint: Coming soon
Thrill’s license is confirmed. The Anjouan public register lists Gravity Unleashed Limitada, license ALSI-202506019-FI1, type B2C, for thrill.com, valid to June 18, 2027.
Who is Thrill best for, and who should skip it?
- Players who want the VIP rules in writing. All 16 levels come with exact XP thresholds, and lower-RTP games earn more XP per dollar.
- Crypto players who shop for fees. Thrill publishes every withdrawal fee, for 26 network and token pairs, and the right chain cuts the fee by up to 100x. The help center sets no max withdrawal.
- Originals fans. 13 provably fair house games carried 70.38% of all bets in the feed, and each has a published max bet.
- You judge games by the live feed. Over 1,206,860 settled bets it pays out 168.09% of stake, and more than it takes in 166 of 168 hours, all 6 stake bands and both halves of the catalog. Treat it as a display.
- You live in Australia, France or Spain. The license its own footer links to excludes all three, and the regulator won’t hear complaints from there. The help center blocks Australia and France, though the Terms name none of the three.
- You want deposit or loss limits. There are none, and no wager limit, time-out or reality check either. Self-exclusion runs 1 to 180 days, and only through support.
- You want to play anonymously. Your username is permanent and public, you can’t hide it, and the feed shows it next to your stake, game, coin and VIP tier.
Sources for this Thrill review
Public bet feed
Public feed · USD-priced bets
- Bets captured
- 1,206,860
- Captured
- Sep 16–23, 2026
Operator documents (25)
- Anjouan public register, searched by license number · License
- thrill.com footer · License
- Terms and Conditions · License
- Help center: About Thrill · License
- Anjouan license validator · License
- Help center: region restrictions · Restricted countries
- Help center: account settings FAQs · Restricted countries
- AML Policy · Restricted countries
- Help center: deposit FAQs · KYC
- Help center: account creation and registration · KYC
- Help center · KYC
- Anti-Fraud Policy · KYC
- Help center: withdrawal limits and fees · Withdrawals
- Help center: how to withdraw · Withdrawals
- Help center: supported cryptocurrencies · Withdrawals
- Help center: level-up bonuses · Bonuses
- Help center: how to claim rewards · Bonuses
- Help center: what is rakeback · Bonuses
- Help center: earning XP and climbing the ranks · Bonuses
- Help center: weekly bonus calculation · Bonuses
- Help center: support contact · Complaints
- Anjouan Gaming: authorized ADR providers · Complaints
- Responsible Gambling policy · Complaints
- Thrill complaint submission form (Google Forms) · Complaints
- Privacy Policy · Complaints
About this Thrill review
Founder and author, 0xCasinos
Alex Savelle runs 0xCasinos and writes everything on it. Since July 12, 2026, Alex has captured 210 million bets from the public feeds of 24 crypto casinos. Alex turns that data into the reviews, rankings and studies on this site.
When a review covers a casino’s rules, Alex reads its terms, help center and license record first. Every document behind a claim is linked, and a review built from the bet feed alone says so. The numbers come from the captured feeds. The casino rules come from the casino’s own documents, dated the day they were read.
- Documents re-read. The Terms dated Sep 16, 2026 add a dormant-account fee of 5% of the remaining balance a month after 12 inactive months, where the old Terms kept the funds available. The help center now lists 12 blocked countries against the Terms’ eight. The license validator shows support@thrill.com and the regulator’s complaint and self-exclusion forms.
- Data refreshed. The public bet capture now covers Sep 16 to Sep 23: 168 hours and 1,206,860 settled bets.
- First published. Operator and license from the Terms, confirmed in the Anjouan public register. The two conflicting exclusion lists, the KYC and rollover rules, the 26-row withdrawal fee table, the full 16-level XP ladder, the missing deposit-limit tool and the unnamed ADR body from the sources above, plus a 168-hour public bet capture of 1,277,326 settled bets.
Thrill withdrawal fees: published for all 26 network and token pairs, up to 100x apart
Thrill charges its own withdrawal fee on all 26 network and token pairs and publishes every one, so the network you pick sets your cost. Each coin’s minimum is tied to its fee. The help center sets no maximum, though Terms §5.4 lets Thrill set limits at its discretion. Thrill publishes no processing time, only typical blockchain arrival times, and your wallet or exchange may charge its own fee on top.
- October 4, 2026
- 5
- 6 of 8
Real-money withdrawal tests: coming soon
Our real-money withdrawal tests are coming soon. Every figure below is the casino’s own published rule, linked to its source.
Thrill withdrawals FAQ: what people ask, answered up front
Quick answers from Thrill’s own cashier rules.
Which network is cheapest to withdraw on at Thrill?
Arbitrum, among the published rows. USDC costs 0.01 there, against 0.1 on Polygon and 1 on Ethereum. For USDT, Solana is cheapest at 0.5, against 1 on Ethereum or Tron.
See the row it came from →What is the minimum withdrawal at Thrill?
It varies by coin and is tied to that coin’s fee, so you can’t withdraw less than the fee: 0.00002504 BTC on Bitcoin, 0.001 ETH on Ethereum, 2.5 USDT on Ethereum. The help center sets no maximum, though Terms §5.4 lets Thrill set one.
See the row it came from →Can Thrill refuse a withdrawal after you’ve wagered the deposit?
Yes. Each deposit needs 1x wagering, and Thrill can void bets that look placed only to clear it, such as opposite betting, low-risk patterns or anything “that does not constitute meaningful gameplay” (Terms §5.7).
See the row it came from →
Thrill withdrawal fee, time and wagering: the key rules
- Published
A published per-network fee across 26 network/token pairs: BTC on Bitcoin 0.00001571, ETH on Ethereum 0.00067447, USDT on Ethereum 1, USDT on Tron 1, USDT on Solana 0.5.
- Not published
No operator processing time is published. The help center publishes typical blockchain arrival times only: under 1 minute on Solana, 1–2 on Tron, 1–3 on BSC and Polygon, 3–15+ on Ethereum, 10–30+ on Bitcoin, under 2 on XRP
- Published
You must wager the full value of each deposit at least once before requesting a withdrawal
Thrill withdrawal terms: every rule, row by row
Every Thrill withdrawal rule, with its clause and source.
Withdrawal fees
The casino fee, the network fee and any charge for withdrawing too often.
Withdrawal fee
Does Thrill charge a withdrawal fee?
- Published
A published per-network fee across 26 network/token pairs: BTC on Bitcoin 0.00001571, ETH on Ethereum 0.00067447, USDT on Ethereum 1, USDT on Tron 1, USDT on Solana 0.5.
The same USDT withdrawal costs 1 USDT on Ethereum or Tron and 0.5 USDT on Solana. USDC costs 1 on Ethereum, 0.1 on Polygon and 0.01 on Arbitrum. The network you pick changes the fee by up to 100×.
Network fee
Who pays the network fee at Thrill?
- Published
Thrill also warns that a receiving wallet, exchange or payment facilitator may charge its own fees on top (Terms §5.2, §5.3)
Source: Terms and Conditions
How often you can withdraw
How many withdrawals a day does Thrill allow?
- Not published
No limit on the number of withdrawals per day is published.
Checked in: Help center: withdrawal limits and fees
Withdrawal time
The processing time the casino states and the confirmations it waits for.
Processing time
How long do Thrill withdrawals take?
- Not published
No operator processing time is published. The help center publishes typical blockchain arrival times only: under 1 minute on Solana, 1–2 on Tron, 1–3 on BSC and Polygon, 3–15+ on Ethereum, 10–30+ on Bitcoin, under 2 on XRP
Checked in: Help center: how to withdraw
Confirmations
How many network confirmations does Thrill need?
- Not published
All deposits require blockchain confirmations, but no confirmation counts are published
Checked in: Help center: deposit FAQs
Withdrawal limits
The minimum, the maximum and what happens to a win too big to pay at once.
Minimum withdrawal
What is the minimum withdrawal at Thrill?
- Published
The minimum varies by currency and is tied to that currency’s withdrawal fee, so you cannot withdraw less than the fee
Minimums from the same table: BTC on Bitcoin 0.00002504, ETH on Ethereum 0.001, USDT on Ethereum 2.5.
Withdrawal limit
Is there a withdrawal limit or max payout at Thrill?
- Published
No maximum. The help center says “you can withdraw as much money as you have available”
Terms §5.2 and §5.4 let Thrill set and change minimum and maximum withdrawal limits at its discretion, announced on the website.
Big wins paid in installments
Does Thrill pay big wins in installments?
- Not published
No rule on paying large wins in installments is published.
Checked in: Terms and Conditions
Coins and networks
The coins and networks the casino pays out on.
Withdrawal coins
Which coins can you withdraw from Thrill?
- Published
15 coins: BTC, ETH, USDT, USDC, DAI, LINK, SHIB, LTC, DOGE, TRX, BNB, SOL, POL, BCH, XRP
Payout networks
Which networks does Thrill pay out on?
- Published
11 networks: Bitcoin, Ethereum, Litecoin, Dogecoin, Tron, Binance Smart Chain, Solana, Polygon, Bitcoin Cash, Arbitrum, Ripple
Before you cash out
What stands between your balance and a payout: wagering, KYC and where the money can go.
Deposit playthrough
Do you have to wager your deposit before withdrawing from Thrill?
- PublishedTerms §5.7
You must wager the full value of each deposit at least once before requesting a withdrawal
Thrill reserves the right to refuse, delay or void any withdrawal where the requirement has not been met. Bets that appear placed only to satisfy the requirement (opposite betting, low-risk patterns or anything “that does not constitute meaningful gameplay”) may be voided. No game weighting or contribution table is published.
Source: Terms and Conditions
KYC and holds
What can delay Thrill withdrawals?
- Published
Thrill reserves the right to delay, refuse or restrict withdrawals, or retain funds, where blockchain analytics or other compliance checks indicate a potential connection to illicit activity (Terms §5.2)
A withdrawal function “may be suspended once it reaches a withdrawal threshold, dependent on its risk profile”, and the threshold itself is not published
Source: Terms and Conditions
Withdrawal destination
Can you withdraw to a different wallet at Thrill?
- Published
Withdrawals are processed using the same method used for deposits “wherever possible” (Terms §5.2)
Source: Terms and Conditions
Thrill withdrawal sources: every document behind this tab
5 documents, checked on October 4, 2026. Any of them can change without notice.
- Help center: withdrawal limits and feeshttps://intercom.help/thrill/en/articles/10130013-crypto-withdrawal-limits-and-fees
- Terms and Conditionshttps://thrill.com/policies/terms-and-conditions
- Help center: how to withdrawhttps://intercom.help/thrill/en/articles/10111022-crypto-how-to-make-a-withdrawal
- Help center: deposit FAQshttps://intercom.help/thrill/en/articles/10110969-crypto-how-to-make-a-deposit-faqs
- Help center: supported cryptocurrencieshttps://intercom.help/thrill/en/articles/10353861-supported-cryptocurrencies
- 6
- 0
- 2
- 0
The eight core questions: fee, processing time, deposit playthrough, minimum, maximum, coins, networks and confirmations. “Named, never stated” means Thrill says the rule exists but prints no figure on a public page. “Not published” means Thrill says nothing. “Not checked by us” is our gap.
Thrill withdrawals compared: how its cashier rules stack up
Thrill answers 6 of the 8 core questions. Across the 23 casinos with a withdrawals tab, the range is 3 to 8. Each card shows how every casino answers one question, and every name links to that casino’s withdrawals tab.
Withdrawal fee
15 of the 23 publish an answer.
Processing time
20 of the 23 publish an answer.
Deposit playthrough
21 of the 23 publish an answer.
“Not checked by us” is our gap, and it never counts against a casino.
Thrill KYC: verified before any deposit, and no verification article in the help center
Thrill verifies your email and account before your first deposit (deposit FAQs). A full check collects your name, home address, date and place of birth, nationality, an ID number and contact details (AML Policy §5a). Low-risk accounts may only need the first three, while enhanced checks add proof of address, ID copies and source of funds (§5e). No completion time is published.
- October 4, 2026
- 6
- No KYC claim published
- 5 of 6 core questions
Where a casino’s marketing and its terms disagree, the terms bind you. Every rule here is the casino’s own, not legal or financial advice.
Our ID-check tests are coming soon. Each rule is dated and linked to its source, and casinos can change them without notice.
Thrill KYC FAQ: what people ask, answered up front
Quick answers from Thrill’s own KYC rules.
Is there a Thrill verification guide?
No. The help center has no verification article, so the rules sit only in the Terms and the AML policy. Thrill can ask for ID documents at any time and suspend the account until they arrive (Terms §4.1).
See the row it came from →Does Thrill have a KYC withdrawal threshold?
Yes, but Thrill doesn’t publish it. A withdrawal can be suspended “once it reaches a withdrawal threshold, dependent on its risk profile”. The only published figure is the anti-fraud policy’s USD 10,000 line for reporting transactions.
See the row it came from →What does Thrill do about forged or missing documents?
It can suspend or close the account, with “the forfeiture of all the funds held in it, to the extent permitted by Law” (Terms §4.3). Trying to get around verification counts the same.
See the row it came from →
Thrill KYC: what it claims, what it requires and when it asks
Thrill makes no claim that KYC is optional or light.
Your email and account must be verified before any deposit (deposit article)
Thrill reserves the right at any time to request identification documents to verify identity, age and location, and may suspend the account until they are provided
- On deposit
- Before a withdrawal
- Any time, at the casino’s discretion
Thrill KYC requirements: every rule, row by row
Every Thrill KYC rule, with its clause and source.
Claim vs terms
What the casino says about KYC, what its terms require and when a check is triggered.
What the casino claims
What does Thrill say about KYC before you sign up?
- Not published
Thrill makes no claim that KYC is optional or light.
The sign-up article says you don’t need KYC documents to finish registering, which matches Terms §3.2 and §4.1: Thrill can ask for them later, at any time.
Checked in: Help center: account creation and registration
What the terms require
What KYC does Thrill require before it pays out?
- Published
Your email and account must be verified before any deposit (deposit article)
Full name, permanent residential address, date of birth, place of birth, nationality, an identity number and contact details. A simplified approach may collect only the first three in low-risk cases (AML Policy §5a)
Source: Help center: deposit FAQs
When KYC is triggered
When does Thrill ask for KYC?
- PublishedTerms §4.1
Thrill reserves the right at any time to request identification documents to verify identity, age and location, and may suspend the account until they are provided
- On deposit
- Before a withdrawal
- Any time, at the casino’s discretion
A withdrawal function “may be suspended once it reaches a withdrawal threshold, dependent on its risk profile”, and the threshold itself is not published
Source: Terms and Conditions
What the check asks for
Accepted documents, KYC levels, the KYC provider and source of funds checks.
Accepted documents
What documents does Thrill accept for KYC?
- Published
Proof of residential address, copies of identification and source of funds, verified directly or through third parties (AML Policy §5e)
Full name, permanent residential address, date of birth, place of birth, nationality, an identity number and contact details. A simplified approach may collect only the first three in low-risk cases (AML Policy §5a)
Source: AML Policy
KYC levels
What are the Thrill KYC levels?
- Not published
The help center has no verification article at all. KYC appears only in the terms and the AML policy
Checked in: Help center
KYC provider
Which KYC provider does Thrill use?
- Not published
Thrill names no KYC provider. Terms §4.2 and AML Policy §5a say only that third-party services may check your details.
Checked in: Terms and Conditions
Source of funds
Does Thrill ask for source of funds?
- PublishedTerms §5.2, AML Policy §5e
Terms §5.2 says checks before a withdrawal can include source of funds, and AML Policy §5e lists source of funds among the documents enhanced due diligence can require.
Source: Terms and Conditions
While KYC is pending
What you can do while a check is pending, and how long it takes. Most casinos on this site publish no review time.
Limits during a check
What can you do at Thrill while KYC is pending?
- PublishedTerms §4.1, §4.3
Terms §4.1 lets Thrill suspend your account until you provide the right documents, and §4.3 lets it withhold funds until verification is complete.
Source: Terms and Conditions
Verification time
How long does Thrill KYC verification take?
- Not published
No verification completion time is published
Accounts with deposit and withdrawal activity are reviewed weekly. Customer and beneficial-ownership data is reviewed annually, more often for high-risk customers (Anti-Fraud Policy §5, §7)
Checked in: AML Policy
If you fail or refuse
What happens if you don’t pass KYC, and what your account and wallet are screened against.
If you don’t verify
What happens if you fail or refuse KYC at Thrill?
- Published
Failure to provide documents, forged documents or an attempt to bypass verification may lead to suspension or termination and “the forfeiture of all the funds held in it, to the extent permitted by Law” (Terms §4.3)
Source: Terms and Conditions
Sanctions, PEP and wallet screening
What does Thrill screen your account and wallet against?
- Published
Sanctions and PEP screening, IP geo-blocking, and Chainalysis analysis of every crypto deposit and withdrawal
The anti-fraud policy is the only document with a number. Transactions above USD 10,000 are reported under the applicable regulatory guidelines
Source: Anti-Fraud Policy
Age and document retention
The minimum age, and how long the casino keeps your documents.
Minimum age
How old do you have to be to play at Thrill?
- Published
18, or the legal age of majority where you live, whichever is greater (Terms §3.1)
Source: Terms and Conditions
Document retention
How long does Thrill keep your documents?
- Not published
No retention period is published. The AML Policy keeps identification records “for the required retention period”, and the Privacy Policy keeps your data while you’re a customer, then for the minimum the law requires.
Checked in: AML Policy
Thrill KYC sources: every document behind this tab
6 documents, checked on October 4, 2026. Any of them can change without notice.
- Help center: deposit FAQshttps://intercom.help/thrill/en/articles/10110969-crypto-how-to-make-a-deposit-faqs
- Terms and Conditionshttps://thrill.com/policies/terms-and-conditions
- AML Policyhttps://thrill.com/policies/aml-policy
- Help center: account creation and registrationhttps://intercom.help/thrill/en/articles/10078775-account-creation-and-registration
- Help centerhttps://intercom.help/thrill/en/
- Anti-Fraud Policyhttps://thrill.com/policies/anti-fraud-policy
- 5
- 0
- 1
- 0
The six core questions: what the terms require, when KYC is triggered, accepted documents, limits during a check, verification time and what happens if you don’t verify. “Not published” means Thrill says nothing. “Not checked by us” is our gap.
Thrill KYC vs other casinos: how its rules compare
Thrill answers 5 of the 6 core questions. Across the 24 casinos with a KYC tab, the range is 4 to 6. Each card shows how every casino answers one question, and every name links to that casino’s KYC tab.
What the terms require
All 24 answer this. A casino gets this tab only if it does.
- Published24
Thrill 500 Casino, AceBet, BC.Game, BetFury, Chips, and 18 more
When KYC is triggered
All 24 answer this. A casino gets this tab only if it does.
Accepted documents
23 of the 24 publish an answer.
“Not checked by us” is our gap, and it never counts against a casino.
Thrill KYC in the full comparison: every casino’s claim next to its terms
One table puts every casino’s KYC claim next to its terms and its triggers. It uses the same records as this tab.
No-KYC claims
Which casinos say “no KYC”, and what do their own terms require?
Every no-KYC claim, quoted and linked, next to the KYC rules in the same casino’s own terms.
Open the full comparison →Thrill license: an Anjouan register match, and a claimed Curaçao license with no number
Thrill’s Anjouan license, ALSI-202506019-FI1, is on the regulator’s register for Gravity Unleashed Limitada and thrill.com, type B2C, issued June 19, 2025 and expiring June 18, 2027. The register returned the same row on October 4, 2026, and the validator linked from Thrill’s footer showed it as VALID that day. Thrill’s help center also claims a Curaçao eGaming license, but no Curaçao number appears in any Thrill policy or footer, and no Curaçao register entry turned up.
- October 4, 2026
- 5
- Checked at the regulator · Anjouan
- 6 of 6 core questions
A license record shows that the licensing relationship was on the regulator’s own record on the day we checked. It says nothing about a casino’s reserves, whether a withdrawal gets paid, how a dispute would end or whether playing is lawful where you live.
We haven’t contacted any regulator or filed a complaint. Every value is the record as it stood on the day we checked, linked so you can check it yourself. Registers and footers can change without notice.
On Oct 4, 2026, the same register marked the status field “valid” for all 1,539 rows it published, including 344 whose expiry dates had already passed. The field is uniform, so it carries no information about this or any individual license.
The Authority’s own status definitions page recognizes four statuses (Active, Suspended, Revoked and Expired) and states that “Only entities with an Active licence status are authorised to conduct licensed internet gaming activities.” “Valid”, the word the register actually prints, is not one of the four.
Thrill license FAQ: what people ask, answered up front
Quick answers from the regulator’s record and Thrill’s own documents.
Is Thrill’s license on the Anjouan register?
Yes. The register lists ALSI-202506019-FI1 for Gravity Unleashed Limitada and thrill.com, type B2C, issued June 19, 2025 and expiring June 18, 2027. The validator linked from Thrill’s footer showed operating status VALID under the same number that day.
See the row it came from →Which license do Thrill’s Terms and footer name?
Only the Anjouan license, ALSI-202506019-FI1. The Terms, the privacy, AML and anti-fraud policies and every footer name Anjouan alone. The Curaçao eGaming license appears only in the “About Thrill” help article, with no number to check.
See every reading →Where is the company behind Thrill registered?
In Costa Rica, as company number 3-102-923055 (Terms §1.1). The Terms print its address as Barrio Dent, San Pedro, and the license validator prints a longer form of the same San Pedro address. Costa Rica doesn’t license online gambling.
See the row it came from →
Thrill license: how it was checked, the number and the holder
On Oct 4, 2026 the Anjouan public register returned one row for Gravity Unleashed Limitada: license ALSI-202506019-FI1, type b2c, issued 2025-06-19, expiring 2027-06-18, domain thrill.com, status Valid, the same row it returned on Sep 8, 2026. The operator-published number, name and domain all match the register. The license validator linked from Thrill’s own footer generated a page on Sep 8, 2026 reading “Operating status: VALID” for thrill.com under the same license number. Reopened on Oct 4, 2026, it showed the same status with support@thrill.com as the licensee’s email, plus two regulator forms below the record, “Submit a Complaint” and “Self Exclusion”.
ALSI-202506019-FI1, returned by the register and the validator and printed identically in every Thrill page footer.
On the register: Gravity Unleashed Limitada. In Terms §1.1: Gravity Unleashed Limitada · Costa Rica company number 3-102-923055.
Checked at the regulator: Checked on the regulator’s own certificate, public register or seal validator. The number, holder and dates shown are the regulator’s, not the casino’s. Checking an Anjouan license: Two Anjouan-branded sites publish these licenses. anjouangaming.com carries the public register. anjouangamingboard.org runs the seal validator and credits the license to the Offshore Finance Authority of the State of Anjouan. The register answers a search. The validator answers only for a casino’s own seal id.
Thrill license record: every field, row by row
Every field on Thrill’s license record, marked regulator or casino, with its source.
How the license was checked
The regulator record we checked, and what the license seal on the casino’s site shows.
Checked at the regulator
Where was Thrill’s license checked?
- Checked at regulator
On Oct 4, 2026 the Anjouan public register returned one row for Gravity Unleashed Limitada: license ALSI-202506019-FI1, type b2c, issued 2025-06-19, expiring 2027-06-18, domain thrill.com, status Valid, the same row it returned on Sep 8, 2026. The operator-published number, name and domain all match the register. The license validator linked from Thrill’s own footer generated a page on Sep 8, 2026 reading “Operating status: VALID” for thrill.com under the same license number. Reopened on Oct 4, 2026, it showed the same status with support@thrill.com as the licensee’s email, plus two regulator forms below the record, “Submit a Complaint” and “Self Exclusion”.
Records checked: Anjouan public register · License validator linked from Thrill’s own footer.
License seal
What does Thrill’s license seal or validator show?
- Checked at regulator
The license validator linked from Thrill’s own footer generated a page on Sep 8, 2026 reading “Operating status: VALID” for thrill.com under the same license number. Reopened on Oct 4, 2026, it showed the same status with support@thrill.com as the licensee’s email, plus two regulator forms below the record, “Submit a Complaint” and “Self Exclusion”.
Source: Anjouan license validator
License number and holder
The license number and company the casino prints, checked against the regulator’s record.
License number match
Does Thrill’s license number match the regulator’s record?
- Checked at regulator
ALSI-202506019-FI1, returned by the register and the validator and printed identically in every Thrill page footer.
Source: Anjouan public register, searched by license number and thrill.com footer
License holder
Who holds Thrill’s license?
- Checked at regulator
On the register: Gravity Unleashed Limitada. In Terms §1.1: Gravity Unleashed Limitada · Costa Rica company number 3-102-923055.
Costa Rica does not license online gambling. The company registration and the gaming license sit in two different jurisdictions, and most players live in neither.
Source: Anjouan public register, searched by license number and Terms and Conditions
Dates, domains and type
Issue and expiry dates, licensed domains and license type, as the record shows them. A date on a register isn’t a ruling on the license.
Issue and expiry dates
When does Thrill’s license expire?
- Checked at regulator
Issued June 19, 2025, expiring June 18, 2027, per the Anjouan public register. That date falls 257 days after October 4, 2026, the day we checked the record.
Licensed domains
Which domains does Thrill’s license cover?
- Checked at regulator
thrill.com, the register’s notified domain, matching the footer.
License type
What type of license does Thrill hold?
- Checked at regulator
B2C Internet Gaming License
Licensing authority
Who issued the license and under which law, and whether the casino’s documents agree.
Licensing authority
Who issued Thrill’s license?
- Two answers
Anjouan Gaming Authority, Autonomous Island of Anjouan, Union of Comoros, under the Computer Gaming Licensing Act No. 007 of 2005. Every Thrill policy and footer, and both regulator records, name this license.
Casino documentThe other reading: The “About Thrill” help center article states that Thrill “operates under two recognized gaming licenses: A Curaçao eGaming license, and An Anjouan Gaming license”.
No Curaçao license number appears in the terms, the privacy policy, the AML policy, the anti-fraud policy or any page footer, and we found no Curaçao register entry for this operator. The Anjouan license checks out on two regulator surfaces. The second claim, Curaçao, has no number attached to it anywhere, so there is nothing to check.
Source: Anjouan public register, searched by license number and Help center: About Thrill
Thrill license: one disagreement on the record
Each card sets one record against another and labels where each reading came from. Where a casino footer and a register differ, the register is the one you can check.
The help center claims two licenses. Every other Thrill document names one.
- Casino document
“About Thrill” help center article
The “About Thrill” help center article states that Thrill “operates under two recognized gaming licenses: A Curaçao eGaming license, and An Anjouan Gaming license”.
- Casino document
Terms, privacy policy, AML policy, anti-fraud policy, every page footer
No Curaçao license number appears in the terms, the privacy policy, the AML policy, the anti-fraud policy or any page footer, and we found no Curaçao register entry for this operator.
Why they differ: The Anjouan license checks out on two regulator surfaces. The second claim, Curaçao, has no number attached to it anywhere, so there is nothing to check.
Thrill license check: what we asked for and didn’t get
Regulator pages that blocked us, timed out or gave the same answer for any domain. A blocked page says nothing about the licensee.
- Our check
Gamecheck seal in the Thrill footer
Thrill’s footer also carries a Gamecheck seal reporting that randomized checks of several suppliers found no fake games. Gamecheck is a commercial game-authenticity service, not a regulator, and its check is not a payout or solvency audit.
What this means: A commercial game-authenticity seal sits next to the regulator seal in the same footer. It isn’t a regulator record and says nothing about the license.
Thrill license research notes: what we checked and what we still don’t know
Our own notes, not the regulator’s or the casino’s statements.
Two versions of the same address
The Terms and the footer print Barrio Dent, San Pedro, Ofident Building, Office 3, San Jose, Montes de Oca, Costa Rica. The validator prints Ofident Building, Office 3, Costa Rican North American Cultural Center, 200M North and 50M East, San Pedro, San Jose 11501, Costa Rica. Neither document explains the difference.
A commercial seal beside the regulator seal
Thrill’s footer also carries a Gamecheck seal reporting that randomized checks of several suppliers found no fake games. Gamecheck is a commercial game-authenticity service, not a regulator, and its check is not a payout or solvency audit.
Thrill license sources: every record behind this tab
5 documents: regulator records first, then Thrill’s own. Registers and footers can change without notice.
- Anjouan public register, searched by license numberhttps://anjouangaming.com/license-register/?license=ALSI-202506019-FI1
- thrill.com footerhttps://thrill.com/
- Terms and Conditionshttps://thrill.com/policies/terms-and-conditions
- Help center: About Thrillhttps://intercom.help/thrill/en/articles/10078699-about-thrill
- Anjouan license validatorhttps://verification.anjouangamingboard.org/validate?domain=thrill.com&seal_id=1b8bf66dee4076f0f735afe37bf3259e75babfb9429dc22a18e20ec6d6635891f2611850914bfe343fe70627c2dedc06&stamp=61140b72f5ca4a82685dd395df6964e6
- 6
- 0
- 0
- 0
The six core questions: how the license was checked, the number match, the holder, the dates, the domains and the authority. “Not published” means Thrill or its register says nothing. “Not checked by us” is our gap.
Thrill license vs other casinos: how the record compares
Thrill answers 6 of the 6 core questions. Across the 24 casinos with a license tab, the range is 5 to 6. Each card shows how every casino answers one question, and every name links to that casino’s license tab.
How the license was checked
All 24 answer this. A casino gets this tab only if it does.
- Published24
Thrill 500 Casino, AceBet, BC.Game, BetFury, Chips, and 18 more
License number match
All 24 answer this. A casino gets this tab only if it does.
License holder
All 24 answer this. A casino gets this tab only if it does.
“Not checked by us” is our gap, and it never counts against a casino.
Thrill license in the full comparison: every license record next to its footer
One table shows every casino’s license number and holder next to the regulator’s record, grouped by regulator and never ranked. It uses the same records as this tab.
Licenses at the regulator
Is the license number in the footer the one the regulator holds?
License numbers as each casino prints them, checked against the regulator’s register or certificate, and what a license doesn’t prove.
Open the full comparison →Thrill restricted countries: eight in the Terms, 12 in the help center, and not the same list
Thrill’s Terms §11.4 name eight territories: Anjouan, the British Virgin Islands, Curaçao, the Dutch Caribbean Islands, Cyprus, the Netherlands, the UK and the US. Its help center now lists 12, adding Australia, France, Germany, Iran and North Korea and dropping Anjouan. The Anjouan license linked from Thrill’s footer also excludes Spain, which neither Thrill list names, and the regulator won’t hear complaints from its excluded territories.
- Documents checked October 4, 2026
- 6 sources cited
- 16 distinct territories named
- 7 of 8 core questions answered by Thrill
Every list here is the casino’s own, not legal advice. We don’t say whether online gambling is allowed where you live, and a country missing from a list isn’t permission. Casinos change these lists without notice.
We haven’t tried signing up from any country.
Don’t use a VPN, a mirror site or a fake address to get around a geo-block. Casinos that publish a penalty name a breach of terms, an account closed without notice or a forfeited balance.
Thrill restricted countries FAQ: what people ask, answered up front
Quick answers from Thrill’s own restricted list and terms.
Which territories does Thrill’s license exclude that its terms don’t?
Australia, France and Spain. The help center’s list now names Australia and France, but Spain sits on neither Thrill list. Outside the license, the Anjouan validator says complaints “will not be entertained”.
See the full list →Why does Thrill’s own clause name Anjouan?
Thrill doesn’t explain it. Terms §11.4 lists it first, spelled “Anjoan”, and Anjouan is the island that issued Thrill’s license. The same clause also prints “The Dutch Carribean Islands”, with Caribbean misspelled.
See the full list →What still works from a region Thrill blocks?
Browsing, logging in and withdrawing may still work, but depositing, registering and playing don’t (help center). Terms §11.4 makes any VPN or proxy bypass a breach, even though the help center says “We don’t actively block VPN usage”.
See the row it came from →
Thrill restricted countries: the list, whether it’s complete, and where else it appears
- Published
Thrill names 8 territories in Terms §11.4, and the first is Anjouan, the island that issued its license.
- Published
Individuals who are located in or reside in Anjoan, the British Virgin Islands, Curaçao, The Dutch Carribean Islands, Cyprus, the Netherlands, the United Kingdom, the United States of America, or any other location where the use of the Services is prohibited by applicable laws or regulations… are not allowed to access the Website or use the Services.
The clause closes “or any other location where the use of the Services is prohibited by applicable laws or regulations”, so the eight names are only the minimum.
- Published
Yes, and it isn’t the same list. It names 12 territories against the Terms’ eight. It adds Australia, France, Germany, Iran and North Korea, and it drops Anjouan. Like the Terms, it ends with a catch-all for anywhere else the law, licensing or sanctions bar the service.
Thrill restricted countries list: every territory it names
16 distinct names across 3 published lists, sorted A to Z so you can find yours. A filled dot means that document names the territory.
Terms §11.4
CasinoThe casino won’t take players from these territories. 8 entries, listed in Terms and Conditions.
Help center: blocked countries
CasinoThe casino won’t take players from these territories. 12 entries, listed in Help center: region restrictions.
Anjouan license exclusions
LicenseThe license doesn’t cover these territories, so the regulator won’t hear your complaint even if the casino takes your account. 7 entries, listed in Anjouan license validator.
The Anjouan license validator linked from Thrill’s footer lists these as territories the license does not extend to, plus all FATF-blacklisted and sanctioned jurisdictions.
Reading the table: Thrill’s Terms and help center say “United States of America” and the license validator says “USA”, so the same country takes two rows. Each name appears exactly as its document prints it.
Thrill restricted countries: every territory rule, row by row
Every Thrill restricted country rule, with its clause and source.
The restricted list
The restricted countries list, where else it appears and whether it’s complete.
Restricted countries
Which countries does Thrill block?
- Published
Thrill names 8 territories in Terms §11.4, and the first is Anjouan, the island that issued its license.
The clause prints “Anjoan” and “The Dutch Carribean Islands”. The list corrects the spelling, and the quote keeps the original.
Source: Terms and Conditions
Second list
Does Thrill publish the same list anywhere else?
- Published
Yes, and it isn’t the same list. It names 12 territories against the Terms’ eight. It adds Australia, France, Germany, Iran and North Korea, and it drops Anjouan. Like the Terms, it ends with a catch-all for anywhere else the law, licensing or sanctions bar the service.
Check both: a country on either list is a reason not to sign up.
Source: Help center: region restrictions
Whether the list is complete
Is Thrill’s restricted list complete?
- PublishedTerms §11.4
Individuals who are located in or reside in Anjoan, the British Virgin Islands, Curaçao, The Dutch Carribean Islands, Cyprus, the Netherlands, the United Kingdom, the United States of America, or any other location where the use of the Services is prohibited by applicable laws or regulations… are not allowed to access the Website or use the Services.
The clause closes “or any other location where the use of the Services is prohibited by applicable laws or regulations”, so the eight names are only the minimum.
Source: Terms and Conditions
How far the block reaches
The license and the game providers can block countries the casino’s own list leaves out.
What the license covers
Does Thrill’s license restrict the same countries?
- Published
Australia, France and Spain are excluded by the license but not named in Thrill’s Terms. The help center’s list now names Australia and France, so Spain is the one license exclusion neither Thrill list mentions, and you have no regulator route from any of the three.
The same page states that disputes, claims or complaints from players inside those territories “fall entirely outside the regulatory scope of the Anjouan Internet Gaming License and will not be entertained”.
Source: Anjouan license validator
Game provider blocks
Do game providers block countries Thrill accepts?
- Named, never listed
Thrill’s account FAQ says features, services or “specific games” may be restricted by your location, and names no game, provider or country.
What the rule covers
Whether the ban follows where you live or where you are, the VPN rules and how the casino checks your location.
Residence or location
Does Thrill’s ban follow where you live or where you are?
- Published
Both. Terms §11.4 covers anyone located in or resident in a listed territory, including visitors while they’re there. The help center adds that access follows your current location, not the country on your account.
Source: Terms and Conditions
Using a VPN
Can you use a VPN at Thrill?
- Published
Terms §11.4 makes any VPN or proxy bypass a breach of the agreement
The help center states “We don’t actively block VPN usage” while repeating that using one to reach a prohibited jurisdiction breaches the terms
Source: Terms and Conditions
How location is checked
How does Thrill check your location?
- Published
AML Policy §5b: users are told about restricted jurisdictions at onboarding, must declare they aren’t located in one, and are geo-blocked by IP address.
Source: AML Policy
Playing from a restricted country
What happens to your account and balance, and what you see from a blocked country.
What happens to the account
What happens to your Thrill account if you play from a restricted country?
- Published
Terms §11.6: breaking the prohibited-jurisdiction rule can mean immediate suspension or termination of the account, with winnings and funds forfeited or reversed.
Source: Terms and Conditions
What a blocked player sees
What do you see at Thrill from a blocked country?
- Published
From a restricted region the help center says browsing, logging in and withdrawing may still work while depositing, registering and playing do not.
Source: Help center: region restrictions
Everywhere else
Any claim about where the casino is open, and who it says must check local law.
Where the casino says it’s open
Where does Thrill say it’s available?
- Not published
Thrill names no country where it’s open. About Thrill says only that one of two licenses governs your access, depending on where you are, in “supported jurisdictions”.
Checked in: Help center: About Thrill
Local law
Who does Thrill make responsible for local law?
- PublishedTerms §3.1, §7.2
You. Terms §7.2 has you warrant that you access the site from a jurisdiction where it’s legal, and §3.1 that you aren’t resident or located where online gaming is prohibited.
Source: Terms and Conditions
Thrill restricted countries research notes: what we checked and what we still don’t know
Our own notes, not the casino’s statements.
Region-blocked games in the lobby
On Oct 4, 2026, logged out, three game tiles in Thrill’s casino lobby read “Unavailable in your region. Disable VPN if active.”
Thrill restricted-country sources: every document behind this tab
6 documents, checked on October 4, 2026. Any of them can change without notice.
- Terms and Conditionshttps://thrill.com/policies/terms-and-conditions
- Help center: region restrictionshttps://intercom.help/thrill/en/articles/10078718-why-isn-t-thrill-available-in-my-region
- Anjouan license validatorhttps://verification.anjouangamingboard.org/validate?domain=thrill.com&seal_id=1b8bf66dee4076f0f735afe37bf3259e75babfb9429dc22a18e20ec6d6635891f2611850914bfe343fe70627c2dedc06&stamp=61140b72f5ca4a82685dd395df6964e6
- Help center: account settings FAQshttps://intercom.help/thrill/en/articles/11452618-account-settings-faqs
- AML Policyhttps://thrill.com/policies/aml-policy
- Help center: About Thrillhttps://intercom.help/thrill/en/articles/10078699-about-thrill
- 7
- 1
- 0
- 0
The eight core questions: the list, a second list, whether it’s complete, what the license covers, game provider blocks, what happens to the account, VPN rules and location checks. “Not published” means Thrill says nothing. “Not checked by us” is our gap.
Thrill restricted countries vs other casinos: how its lists compare
Thrill answers 7 of the 8 core questions. Across the 22 casinos with a countries tab, the range is 4 to 8. Each card shows how every casino answers one question, and every name links to that casino’s countries tab. Thrill names 16 distinct territories, the 19th longest list of the 22. The lists run from 9 to 85 names. A longer list means a more detailed document, not a stricter casino.
Restricted countries
All 22 answer this. A casino gets this tab only if it does.
- Published17
Thrill 500 Casino, Cloudbet, CoinCasino, DegenCity, Gamba, and 11 more
- Two answers5
Second list
17 of the 22 publish an answer.
Whether the list is complete
21 of the 22 publish an answer.
“Not checked by us” is our gap, and it never counts against a casino.
Thrill complaints: escalation by Google Form and complaints@thrill.com, no dispute body named
Thrill’s complaint route starts with live chat or support@thrill.com, stated as 24/7. You escalate “to management” at complaints@thrill.com (Terms §28.2) or through a Google Form linked from the footer, built in a workspace named “Paradym”. No response deadline is published, and §28.3 makes Thrill’s decision final “unless otherwise determined by an external adjudicator” it never names. Anjouan requires an approved ADR provider, and Thrill names none. Self-exclusion runs 1 to 180 days through support, with no permanent option. Since the September 16, 2026 Terms, a dormant account also loses 5% of its balance every month (§6.2).
- Documents checked October 4, 2026
- 6 sources cited
- Regulator route checked
- 4 of 6 core questions answered by Thrill
Where the regulator describes a different route from the casino, the regulator’s route is the one you’d have to use. This is the casino’s published route, not legal advice.
Our support-chat tests are coming soon. We haven’t filed a complaint or used a self-exclusion tool at any casino. Each rule is dated and linked to its source, and casinos can change them without notice.
Thrill complaints FAQ: what people ask, answered up front
Quick answers from Thrill’s own documents and its regulator.
What does the Thrill complaint form ask for?
Your name, email, date of birth, address and Thrill username, the date and time of the incident, the amount, whether you contacted support, a description and one of eleven categories. Supporting files go separately to complaints@thrill.com.
See the row it came from →Who is Thrill’s “external adjudicator”?
Thrill doesn’t say. §28.3 makes its decision final unless an external adjudicator determines otherwise, and no Thrill document names an ADR provider. Anjouan requires licensees to use an approved provider, at the operator’s cost.
See the row it came from →Is there a permanent self-exclusion at Thrill?
No. Thrill publishes no permanent or indefinite option. Periods run 1 to 180 days, requested by live chat or support@thrill.com, with no self-service control. Thrill can also refuse to reopen an account that shows signs of compulsive behavior.
See the self-exclusion rules →
Thrill complaint route: where it starts, where it goes, and who is named
- Published
Live chat on site or support@thrill.com, available 24/7
- Published
complaints@thrill.com, described as escalation “to management” (Terms §28.2)
- Not published
Thrill names no ADR provider in any of its documents
Thrill complaint and self-exclusion terms: every rule, row by row
Every Thrill complaint and self-exclusion rule, with its clause and source.
Complaining to the casino
Where to complain, the deadlines on both sides, the complaints clause, the form and who settles a disputed bet.
Where a complaint starts
How do you file a complaint with Thrill?
- Published
Live chat on site or support@thrill.com, available 24/7
Source: Help center: support contact
Complaint deadlines
What are the Thrill complaint deadlines?
- Not published
Thrill publishes no response deadline of its own
Checked in: Terms and Conditions
Complaints clause
Which Thrill terms clause covers complaints?
- Published
Terms §28 (Complaints and Disputes)
Support first (§28.1), then complaints@thrill.com for management (§28.2), then a final decision unless an external adjudicator rules otherwise (§28.3).
Source: Terms and Conditions
Complaint form
Does Thrill have a complaint form?
- Published
A Google Form titled “THRILL COMPLAINT SUBMISSION FORM”, linked from the site footer
Full name, email, date of birth, address, Thrill username, incident date and time, amount involved, whether support was contacted, a description and one of eleven complaint categories
Who decides a disputed bet
Who settles a disputed bet at Thrill?
- Published
Terms §28.3: “our decision shall be final unless otherwise determined by an external adjudicator”
Terms §9.6: “In the event of any dispute, our decision is final”
Source: Terms and Conditions
Message retention
How long does Thrill keep your support messages?
- Published
Data is kept while you are a customer and afterwards for the minimum period required by the policy and by law. Communications may be retained for up to six years (Terms §24.5)
Source: Privacy Policy
Escalating past the casino
The escalation route, the ADR body, the regulator, and the law and courts the terms pick. Those courts are often not in the country that issued the license.
Escalation route
Where can you escalate Thrill complaints?
- Published
complaints@thrill.com, described as escalation “to management” (Terms §28.2)
Maximum liability is capped at the total amount you have deposited into your account (Terms §16.3)
Source: Terms and Conditions
Named ADR body
Does Thrill name an ADR body?
- Not published
Thrill names no ADR provider in any of its documents
Checked in: the documents listed below
What the regulator says
Can you complain to Thrill’s regulator?
- Published
The Anjouan Gaming Authority requires every licensed operator to engage one or more approved ADR providers, requires the operator to attempt resolution within 30 days, and states the operator bears the cost of the ADR proceedings.
Approved providers: EGIS ADR, Axion ADR, iGaming ADR, CADRE B.V. The license validator states that complaints from players in the license’s excluded territories will not be entertained.
Governing law and courts
Which law and courts govern Thrill’s terms?
- Published
The laws of the Autonomous Island of Anjouan, Union of Comoros (Terms §20.1)
Source: Terms and Conditions
Class actions and jury trial
Do Thrill’s terms waive class actions or jury trials?
- Published
Exclusive jurisdiction of the courts of Anjouan, with no class or representative actions (Terms §20.2)
Source: Terms and Conditions
Self-exclusion and limits
Self-exclusion, deposit limits, cool-offs, account closure and inactive accounts.
Self-exclusion
How do you self-exclude at Thrill?
- Published
By contacting live chat or support@thrill.com. There is no self-service control. Periods: 1 to 180 days.
No permanent or indefinite self-exclusion option is published. Thrill may suspend or close an account showing signs of compulsive behavior and reserves the right to deny reactivation (Responsible Gambling §4).
Periods, waiting period and balance rules are in the self-exclusion table below.
Source: Responsible Gambling policy
Deposit, loss and wager limits
Can you set deposit limits at Thrill?
- Not published
No deposit limit tool is published in any Thrill document. No loss limit tool is published. No wager or session limit tool is published.
Checked in: Responsible Gambling policy
Time-out or cool-off
Does Thrill offer a cool-off or time-out?
- Not published
No short time-out or cool-off control is published
Checked in: Responsible Gambling policy
Account closure
How do you close your Thrill account?
- PublishedTerms §19.2, §19.3
You can close your account at any time by contacting customer support, and you keep the right to withdraw your withdrawable balance if you ask before it closes (Terms §19.2). Unclaimed rewards and bonuses are forfeited (§19.3).
Source: Terms and Conditions
Inactive accounts
What happens to an inactive Thrill account?
- Published
After 12 inactive months the account may be deemed dormant, and Thrill may suspend or freeze it and charge a monthly fee of 5% of the remaining balance (Terms §6.2).
Source: Terms and Conditions
Dormancy fee
Does Thrill charge a dormancy fee?
- Published
A monthly administrative fee of 5% of the remaining balance, charged each month the account stays dormant. A balance under $5 can be taken whole, and no fee takes the balance below zero (Terms §6.2).
Source: Terms and Conditions
Gambling help links
Which gambling help groups does Thrill link to?
- Published
BetBlocker, Gamban, Gambling Therapy and Gamblers Anonymous
Source: Responsible Gambling policy
Thrill self-exclusion: as its document states it
Thrill’s self-exclusion rules in its own words or a close paraphrase, checked on October 4, 2026.
By contacting live chat or support@thrill.com. There is no self-service control. Periods: 1 to 180 days.
No permanent or indefinite self-exclusion option is published. Thrill may suspend or close an account showing signs of compulsive behavior and reserves the right to deny reactivation (Responsible Gambling §4).
Source: Responsible Gambling policy
A cell that says a rule isn’t published is about Thrill. “Not recorded by us” is our gap. The criteria shortlist checks every casino for self-service self-exclusion with a published period, from these same documents.
Thrill complaints research notes: what we checked and what we still don’t know
Our own notes, not the casino’s statements.
Thrill’s complaint form sits in a workspace that isn’t thrill.com
Google reports the form as created in a workspace domain named “Paradym”, not a thrill.com domain. Supporting files must be emailed separately to complaints@thrill.com.
The license requires deposit limits, and Thrill’s policy has none
The Anjouan license validator states the operator “must adhere to international Anti-Money Laundering (AML) protocols and provide functional Responsible Gaming (RG) tools, including self-exclusion and deposit limit capabilities”. Self-exclusion is published. A deposit limit is not, and the deposit article states there is no minimum or maximum deposit limit for any supported cryptocurrency.
The regulator’s forms on Thrill’s seal page
On Oct 4, 2026, Thrill’s validator page carried the regulator’s “Submit a Complaint” form below the license record. Anjouan Licensing Services Inc.’s “Submit a Complaint” form takes complaints that an operator is breaching its license. Payout, blocked-account, delay and broken-feature disputes go to the operator first. The form asks for your name, email, phone, address, country, date of birth, the operator URL, the disputed amount, the games played, the dispute details and the date and time of play, plus screenshots and chats, photo ID, proof of address and proof of source of funds. Thrill’s Anjouan validator page carries a self-exclusion request form with a 2-day or 1-week cool-off, or 1, 2, 3 or 6 months, 1 year or permanent. The regulator says the list goes only to operators on the Anjouan Gaming platform.
Thrill complaints sources: every document behind this tab
6 documents, checked on October 4, 2026. Any of them can change without notice.
- Help center: support contacthttps://intercom.help/thrill/en/articles/10078789-support-contact
- Terms and Conditionshttps://thrill.com/policies/terms-and-conditions
- Anjouan Gaming: authorized ADR providershttps://anjouangaming.com/authorized-adr-providers/
- Responsible Gambling policyhttps://thrill.com/policies/responsible-gambling
- Thrill complaint submission form (Google Forms)https://forms.gle/9AEJf9FiDn3AHypk9
- Privacy Policyhttps://thrill.com/policies/privacy-policy
- 4
- 0
- 2
- 0
The six core questions: where a complaint starts, the escalation route, the deadlines, the ADR body, what the regulator says and how self-exclusion works. “Not published” means Thrill says nothing. “Not checked by us” is our gap.
Thrill complaints compared: how its route stacks up
Thrill answers 4 of the 6 core questions. Across the 24 casinos with a complaints tab, the range is 3 to 6. Each card shows how every casino answers one question, and every name links to that casino’s complaints tab.
Where a complaint starts
All 24 answer this. A casino gets this tab only if it does.
- Published24
Thrill 500 Casino, AceBet, BC.Game, BetFury, Chips, and 18 more
Escalation route
15 of the 24 publish an answer.
Named ADR body
5 of the 24 publish an answer.
- Published4
- Two answers1
- Not published19
Thrill AceBet, BC.Game, Chips, CoinCasino, DegenCity, and 13 more
Self-exclusion
24 of the 24 publish an answer.
- Published5
Thrill 500 Casino, AceBet, Gamdom, Reels.io
- Two answers19
BC.Game, BetFury, Chips, Cloudbet, CoinCasino, DegenCity, and 13 more
“Not checked by us” is our gap, and it never counts against a casino.
Thrill self-exclusion compared: every casino scored the same way
The shortlist checks every casino against the same six published terms, including self-service self-exclusion for a published period. It uses the same research as this tab.
Criteria shortlist
Which crypto casinos meet every published term we can check?
Every casino we cover, checked against the same published terms and grouped by how many it meets, A to Z in each group. A shortlist, not a ranking.
Open the criteria shortlist →Thrill bet data: 0.083% of bets carried 43.58% of all payout
We counted every figure on this tab from the bets Thrill’s public feed showed in this window. None of it comes from Thrill itself.
- 1,206,860
- 168
- Sep 16–23, 2026
- $6.3M
- 168.09%
- Payout ÷ stake in this feed
- $4.3M
About the Thrill feed
- Source: Public feed · USD-priced bets. Settled bets and the weight of big bets.
Thrill bet data: key findings
$4.65M
Thrill’s top 1,000 payouts carry 43.58% of all payout
Those bets staked $1.82M and paid out $4.65M, a player net of +$2.83M.
Sorted by payout, not by odds or expected value.
172.09%
Cutting Thrill’s biggest bets moves the ratio a different way
The full payout ratio is 168.09%. Without the 100 biggest bets, it becomes 172.09%.
The removed bets aren’t treated as unusual or invalid.
70.38%
13 Thrill Originals take most of the bets
849,447 bets land on Thrill Originals and 357,413 on third-party games.
Split by the feed’s provider labels, not by what you can play.
Thrill payout ratio: 168.09% of stake paid back
Thrill players won $4.3M on the bets we captured.
168.09%
Payout ÷ stake across 1,206,859 priced bets (100.0% of the feed). It’s a feed ratio, not a game’s RTP.
- Stake captured$6.3M
- Paid back$10.7M
Where Thrill ranks: #3 of 15 on best payout ratio
- #3Best payout ratio$10,662,074.19 paid out on $6,343,093.90 staked168.09%
- #9Highest volume$6,343,093.90 staked in 168 hours$37.76K/hr
- #3Most active feeds1,206,860 bets in 168 hours7.18K/hr
- #5Largest player netPlayers finished $4,318,980.29 up+$4.32M
- #12Average bet$6,343,093.90 staked over 1,206,859 bets$5.26
Biggest Thrill wins in the public feed
The top multiplier in this window was 9,900× on Dice.
Highest multipliers in this capture window. Amounts are as the feed priced them.
Thrill bet sizes: half of all bets under $0.24
The largest 1% of Thrill bets carried 68.8% of all stake.
Thrill bet size percentiles
- 10% of bets under$0.02
- 25% under$0.06
- Half under$0.24
- 75% under$1.00
- 90% under$3.98
- 99% under$62.01
Bets by stake size
- < $0.1032.4%0.3% of stake
- $0.10–$142.9%2.9% of stake
- $1–$1019.5%10.4% of stake
- $10–$1004.5%22.1% of stake
- $100–$1,0000.6%29.7% of stake
- $1,000–$10,0000.1%24.9% of stake
- ≥ $10,0000.0%9.8% of stake
Thrill win rate: 49.0% of bets paid something
- Paid back at least the stake (≥ 1×)41.6%
- Doubled the stake (≥ 2×)20.5%
- ≥ 10×3.0%
- ≥ 100×0.170%
- ≥ 1,000×0.000%
The median paying bet returned 1.36× its stake.
Most played games at Thrill: Dice leads
Dice took 20.9% of all Thrill bets in this window.
Thrill currencies: SOL on 28.7% of bets
- SOL28.7%14.6% of stake
- USDC22.6%28.4% of stake
- USDT20.3%36.6% of stake
- ETH8.8%11.6% of stake
- XRP3.6%1.7% of stake
- DOGE3.0%0.2% of stake
- LTC2.8%1.0% of stake
- POL2.7%0.2% of stake
- TRX2.7%1.3% of stake
- BTC2.6%1.3% of stake
When Thrill is busiest: Fri 13:00 UTC
Quietest hour: Fri 04:00 UTC. Busiest hours at every casino
Thrill bet data since Jul 12, 2026: 11,787,338 bets
- Jul 12, 2026
- Sep 23, 2026
- 11,787,338
- 1,543
- 87.5%
- Keno (Thrill)
How we captured the Thrill bet data
Our collector reads Thrill’s public bet feed, the live bets list on its own site. It stores every bet with the time we captured it. This tab covers the last seven days of capture, or the whole capture if it ran shorter. A public feed isn’t Thrill’s full record, and our capture has gaps. Every figure here describes what the feed showed. How to read the data