


Shuffle Casino Review 2026: Is it legit? Licensed, but its complaints procedure is unpublished
Shuffle is a crypto casino and sportsbook licensed in Curaçao, and the regulator’s certificate confirms it. It publishes its full VIP ladder and a rakeback formula. Its Terms send complaints to a regulator that says it doesn’t handle them. Our real-money tests are coming soon.


 +3
+3- Before first withdrawal
- May charge, no schedule
- 90% under a minute
- 19 territories
99.63% paid back
of the stake on 535,704 captured bets
Sep 16–23, 2026 · a feed ratio, not a game’s RTP
21 sections
Shuffle FAQ: what people ask, answered up front
Is Shuffle legit and safe?
Yes, Shuffle is licensed. The regulator’s certificate shows Natural Nine B.V. holding OGL/2024/1337/0628, granted October 16, 2024, for shuffle.com. Its complaints procedure isn’t published, and our real-money tests are coming soon.
See the license record →Who owns Shuffle?
Shuffle is run by Natural Nine B.V. (Curaçao Chamber of Commerce registration number 160998), incorporated in Curaçao in 2022, under license OGL/2024/1337/0628. Shuffle names no directors or beneficial owners.
See the operator record →Is Shuffle available in the US, the UK or Australia?
No. All three are among the 14 jurisdictions in Terms §8.3, along with France, Germany, the Netherlands, Spain, Sweden and Curaçao itself. A catch-all adds anywhere the US, the EU or the UK embargoes, and Terms §8.4 makes using a VPN a breach.
See every prohibited jurisdiction →Are Shuffle’s games provably fair?
Yes, Shuffle Originals are. They use a committed server seed, your own client seed and an incrementing nonce under HMAC-SHA256, and you can recheck any bet. Third-party titles sit outside that scheme, and Shuffle says it proves randomness, not payout rates.
See the games chapter →Does Shuffle require KYC?
Yes, whatever the homepage says about light KYC. Shuffle checks your ID before your first withdrawal in every case (Terms §5.2), and Terms §5.1 lets it ask at any time. The threshold for an earlier check isn’t published.
See the KYC stages →Does Shuffle have a sign-up bonus or promo code?
Not a standing one. Shuffle’s homepage says deposit bonuses “rotate regularly”, and each offer’s match, cap and minimum deposit show only in its promotion. Its general Deposit Bonus Terms set a $10 max bet and 30 days to clear the WR.
See the bonus terms →Do I have to wager my deposit before withdrawing from Shuffle?
Yes, 100% of it, bonus or no bonus (Terms §10.2). The only exception is crypto sent back to the exact wallet and network it came from. A deposit bonus adds its own WR, set by each promotion.
See the rollover terms →How fast are Shuffle withdrawals?
Shuffle’s homepage says 90% of crypto withdrawals take under a minute, though Terms §7.2 warrants no time. CAD withdrawals by Interac take instant to 30 minutes. Any Shuffle fee shows before you confirm (§10.7). Our real-money tests are coming soon.
See the cashier rules →What rakeback does Shuffle pay?
Shuffle pays 5% of the house edge of the games you play, returned as cash, from Bronze, on casino bets only. By Shuffle’s own example, 1,000 USDT wagered at a 2% edge returns 1 USDT, or 0.1% of turnover. The rate by rank isn’t published.
See how rakeback works →What does it cost to reach the top of Shuffle’s VIP program?
The top rank, Legend, takes 10,000,000,000 XP. Diamond, where the feed’s top band starts, takes 17,000,000 XP, or $17,000,000 of casino bets at 1 XP per $1. 60 aliases in that band staked $12.8M in our week, 28.93% of visible stake.
See the VIP ladder →Are Shuffle’s own games most of the action?
Yes, on bets. 17 in-house titles took 60.54% of captured bets, against 3,177 third-party titles from 47 unnamed channels. On money it flips, and third-party titles took 53.12% of the stake.
See both catalogs →Does the data show Shuffle’s RTP?
No. The feed shows a payout ratio of 99.63% across 535,704 USD-priced bets, which is not a game’s RTP or a house edge. Take out the 100 biggest payouts and it reads 91.85%. Another 3.95% of bets had no USD value.
See the tail cut →Can you tell how many players are in the Shuffle data?
No. 46.09% of captured bets hide their source identity and carry 65.29% of the stake, so they can’t be split into accounts. Of the visible aliases, 16,027 had a priced bet, and the top ten carried 13.77% of stake.
See what identity is missing →How do I complain to Shuffle if something goes wrong?
Contact support by live chat or email and keep every hash and timestamp. Past support, the Complaints Handling Procedures aren’t published, the Curaçao regulator says it doesn’t resolve disputes, and the XCM seal points to complaints@xcm.cw.
See the complaint route →
Shuffle at a glance
Natural Nine B.V. holds Shuffle’s Curaçao license, OGL/2024/1337/0628. Four Shuffle documents give the same company, company number and license. Shuffle also publishes more of its rules than most crypto casinos:
- The full VIP ladder, with exact XP thresholds
- A rakeback formula with a worked example
- Max bet and max win caps for each Shuffle Original
Shuffle’s complaint route breaks in two places. The Complaints Handling Procedures its Terms rely on aren’t published. The regulator the Terms escalate to says it doesn’t handle player disputes. Its self-exclusion policy also contradicts itself. In the public bet feed, 100 of 557,743 bets carried 10.96% of all payouts.
- Curaçao Gaming Authority
- OGL/2024/1337/0628
- Natural Nine B.V. · Curaçao Chamber of Commerce registration number 160998
- 19 territories
- Oct 4, 2026
- 557,743
- Sep 16–23, 2026
- 168 hours
- +5
Shuffle screenshots: the logged-out lobby on desktop and mobile
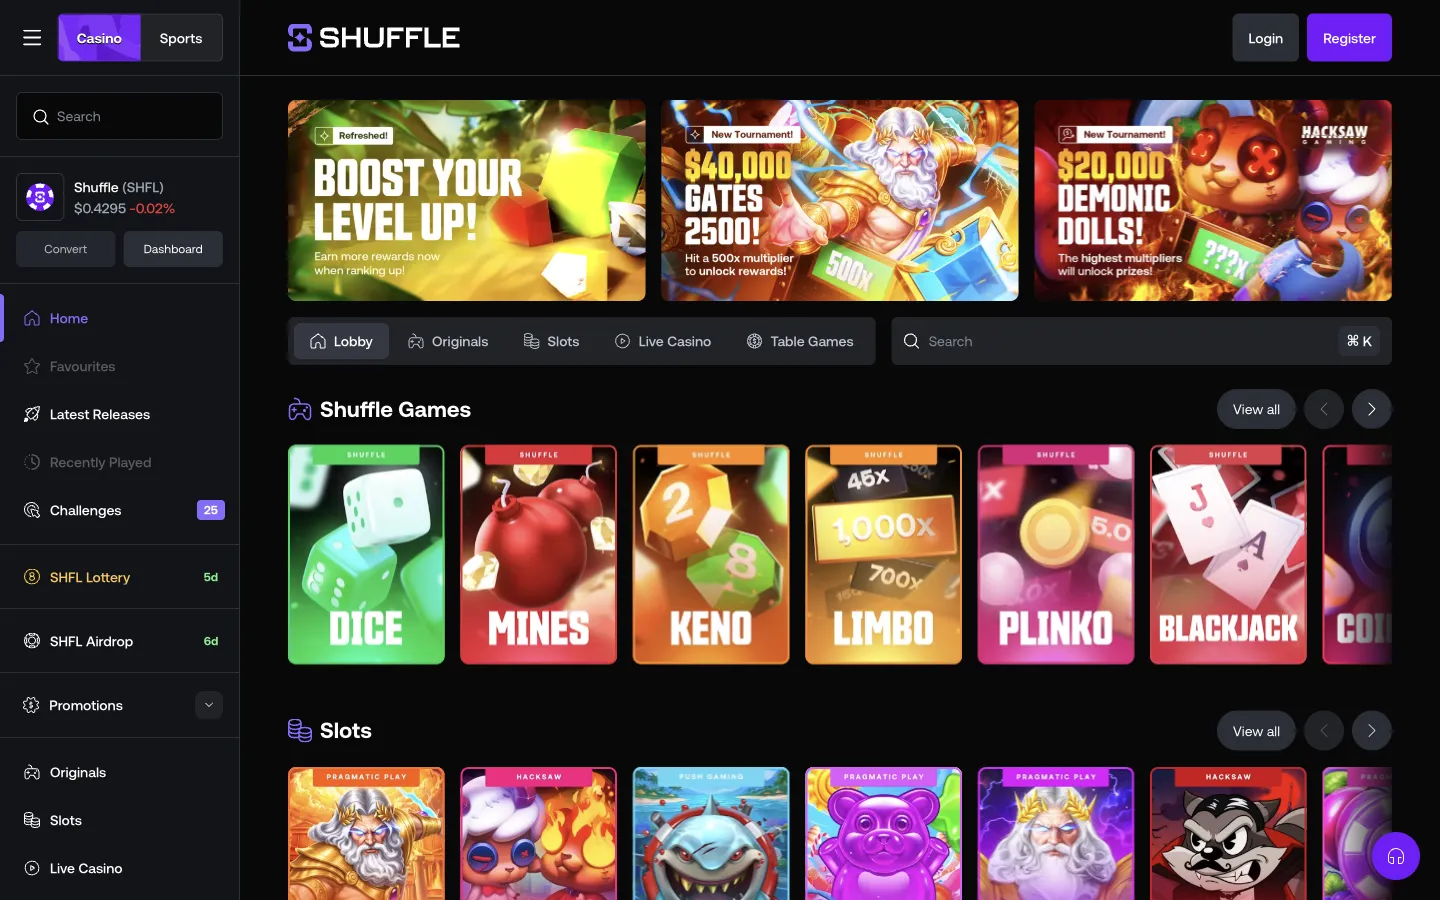
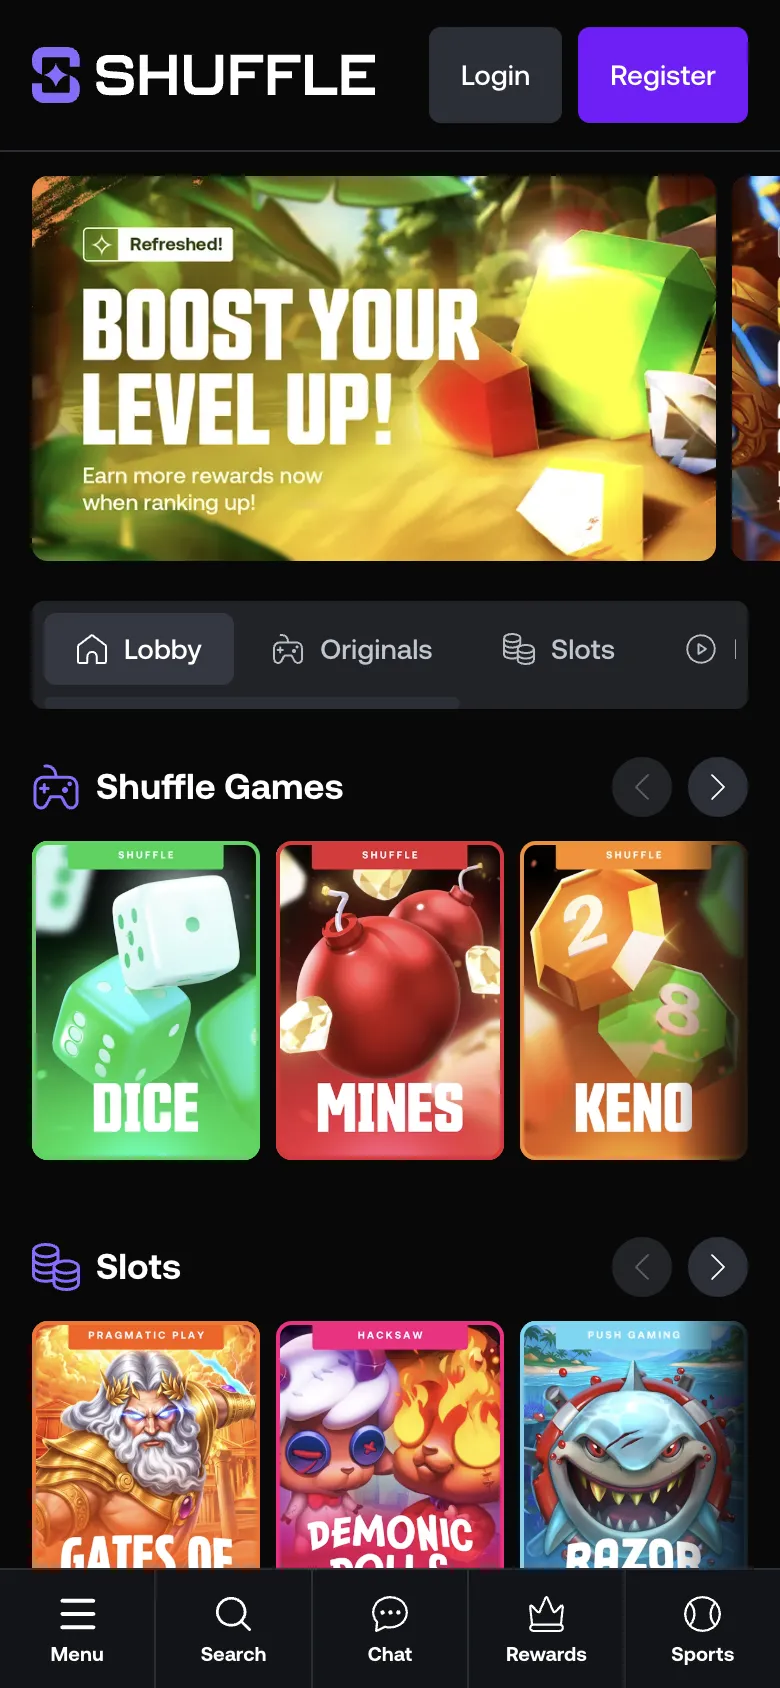
shuffle.com, logged out, Oct 3, 2026.
Shuffle pros and cons
Pros
- License OGL/2024/1337/0628 shows Active on the regulator’s certificate, granted October 16, 2024
- Four Shuffle documents name the same company, number and license
- VIP ladder published to the last XP threshold, with level-up bonuses priced up to Diamond
- Published rakeback rate with a worked example (5% of the house edge of the games you play, returned as cash)
- Per-game max bet and max win caps for Shuffle Originals
- Wager and loss limits carry a one-day cooling-off before any change
Cons
- The Complaints Handling Procedures the Terms rely on aren’t published
- The regulator the Terms escalate to says it doesn’t resolve player disputes
- The self-exclusion policy calls it irreversible, then says it lapses unless you reconfirm by email
- 14 jurisdictions restricted, plus an open-ended catch-all
- You must wager 100% of every deposit before you withdraw, bonus or not
- No deposit limit, session limit or time-out, and no published fee schedule or crypto minimum
- The homepage sells light KYC, while the Terms check your ID before your first withdrawal
What to check before you deposit at Shuffle
1Does Shuffle accept players where you live?
14 jurisdictions named, plus a catch-all
Terms §8.3 names Australia, France, Germany, the Netherlands, Singapore, Spain, Sweden, the UK, the US and more. A catch-all adds anywhere else that would need a license.
See the evidence →Read §8.3 in full and check your local law before you sign up.
2What do you need before you withdraw?
Wager 100% of your deposit
The rule covers every player, bonus or not (Terms §10.2). A deposit bonus adds its own WR, set by each promotion and weighted by house edge.
See the evidence →Treat every deposit as locked until you’ve wagered it once in full.
3Where does a complaint end up?
At Shuffle’s support
The procedures document the Terms rely on isn’t published. The regulator the Terms escalate to says on its own site that it doesn’t resolve player disputes.
See the evidence →Keep every transaction hash and message, and treat support as your only real option.
4What did the public bet feed show?
99.63% paid back, on 96.05% of bets
100 bets carried 10.96% of all payouts, and 3.95% of captured bets had no USD value at all.
See the evidence →Treat a one-week payout ratio as a snapshot, not a forecast.
How we checked Shuffle
These are the checks behind this review, each with its date. The numbers come from Shuffle’s public bet feed and the rules from its own documents. Our method
- License checked at the regulator
Four Shuffle documents give the same company, company number and license number, and the certificate matches all four. They disagree on what the regulator is called.
- Operator documents read
20 documents from Shuffle’s terms, help center and policies, each one linked under Sources.
- Public bet feed captured
557,743 bets over 168 hours, Sep 16–23, 2026. Source: Public feed · USD-priced bets.
Coming soon
We haven’t deposited at Shuffle yet. Each result will land here with its date and how long it took.
- Deposit
How long a crypto deposit takes to credit, on two networks.
- Withdrawal
How long a withdrawal takes to reach our wallet, and every fee on the way.
- Support chat
How fast a human replies in live chat, and whether the answer matches the terms.
- KYC check
What the casino asks for, when it asks, and how long approval takes.
Shuffle score: 8.2 out of 10
- License9.4Answered: how the license was checked, license number match, license holder, issue and expiry dates and licensed domains. Conflicting or only pointed at: licensing authority.
- Withdrawals7.0Answered: processing time, withdrawal limit, withdrawal coins, payout networks and deposit playthrough. Conflicting or only pointed at: withdrawal fee and minimum withdrawal. Not published: confirmations.
- KYC10.0Answered: what the terms require, when KYC is triggered, accepted documents, limits during a check, verification time and if you don’t verify.
- Complaints & self-exclusion6.6Answered: where a complaint starts and escalation route. Conflicting or only pointed at: complaint deadlines, what the regulator says and self-exclusion. Not published: named ADR body.
- Restricted countries8.2Answered: restricted countries, second list, whether the list is complete, what happens to the account, using a VPN and how location is checked. Not published: what the license covers and game provider blocks.
- Bonus terms6.6Answered: bonus expiry, rakeback or reward rate, game contribution, max bet while wagering and forfeiture rules. Conflicting or only pointed at: bonus offer, wagering requirement and max cashout.
- Public bet feed10.0The feed shows losing bets as well as wins, in dollars, so its totals can be checked.
Overall
8.2
Weighted from Shuffle’s own documents, its license record and its public feed. How we score
Shuffle restricted countries: where can’t you play?
One list, in the Terms onlyShuffle restricts 14 jurisdictions by name in Terms §8.3, Curaçao included. A catch-all then bans anywhere else where offering the service would need a license. The AML policy adds a separate sanctions list of 5 names, none of them in §8.3. The help center republishes neither list. This is Shuffle’s list, not legal advice.
Shuffle’s catch-all clause
The fourteen names are only the minimum. §8.3 ends with a catch-all for any location where the service would need licensing or registration, or that the US, the EU or the UK embargoes. None of those embargo lists is reproduced or linked. A country missing from both Shuffle lists can still fall under the catch-all. Read Terms §8.3
- Terms §8.3: 14 jurisdictions. Curaçao, where Shuffle is licensed, is the fourth name on the list. The US, the UK and most of the regulated EU market are on it too.
- The catch-all: Open-ended. Anywhere the service would need licensing or registration, or that the US, the EU or the UK embargoes. The real list is longer than fourteen names, by an unknown number.
- The AML policy: 5 more names. A separate sanctions list. None of its names is in §8.3.
Can you use a VPN at Shuffle?
No. Terms §8.4 makes hiding your location a breach on its own, so a VPN or a false address is no workaround. The AML policy also says Shuffle geo-blocks by IP and checks your device’s time zone against restricted jurisdictions. It may refuse funding from a known U.S.-based exchange wallet, which it reads as a sign you’re a U.S. person.
Canada isn’t named in §8.3, and Shuffle’s help center even carries a Canadian-dollar guide for Interac payments. We found no Ontario iGaming registration for Shuffle.
Restricted countries list
Shuffle doesn’t accept players from these 19 territories.
- Australia
- British Virgin Islands
- Cayman Islands
- Curaçao
- Cyprus
- France
- Germany
- Netherlands
- Portugal
- Singapore
- Spain
- Sweden
- United Kingdom
- United States
- Iran
- Cuba
- North Korea
- Syria
- Crimean region of Ukraine
Who owns Shuffle, and does its license check out?
Checked at the regulatorNatural Nine B.V. (Curaçao Chamber of Commerce registration number 160998) runs Shuffle under Curaçao license OGL/2024/1337/0628. Four Shuffle documents agree on that. On Oct 4, 2026, the certificate on the Curaçao Gaming Authority’s own domain matched them down to the licensed domain. Open the license certificate
Shuffle license certificate
The Curaçao Gaming Authority’s certificate reads:
This is to certify that shuffle.com is operated by Natural Nine B.V., a company incorporated under the laws of Curaçao with Company Number 160998 and licensed by the Curaçao Gaming Authority to offer games of chance under license number OGL/2024/1337/0628.
Shuffle ownership: still to verify
- Directors: Not named in Shuffle’s documents
- Beneficial owners: Not named in Shuffle’s documents
- Paying agent: None named. Payments run through Natural Nine B.V. itself and unnamed third-party processors (Terms §1.2).
Shuffle’s licensed domains and footer seals
The certificate also lists 41 active related domains registered under shuffle.com, from shuffle.ag to shuffle888.com. Ten of them are numbered disorder domains, from disorder1.com to disorder11.com. A second seal in the footer comes from XCM, Shuffle’s compliance manager, and shows shuffle.com as VALID. It sends complaints to complaints@xcm.cw once Shuffle’s own procedure is exhausted.
Shuffle regulator: two names for one body
The Terms say “the Curaçao Gaming Authority” (§1.1, §18.2). The license page and the AML policy say “the Curaçao Gaming Control Board”. The regulator’s own site says the GCB is now referred to as the Curaçao Gaming Authority, so both names mean the same body. The name matters because Terms §18.2 sends unresolved complaints to that body.
iTech Labs certified the RNG behind Shuffle Originals for Natural Nine B.V. on January 13, 2025. The lab hosts the certificate, not Shuffle.
- Natural Nine B.V.
- Curaçao Chamber of Commerce registration number 160998
- Korporaalweg 10, Willemstad, Curaçao
- 2022, in Curaçao
- OGL/2024/1337/0628
- Curaçao Gaming Authority
- October 16, 2024
- Active
License
- Curaçao Gaming Authority
- OGL/2024/1337/0628
- Natural Nine B.V. · Curaçao Chamber of Commerce registration number 160998
- Checked at regulator
Shuffle KYC: when will Shuffle ask for ID?
ID before first withdrawalShuffle can ask for KYC at any time (Terms §5.1), and it always checks your ID before your first withdrawal (§5.2). Most crypto casinos commit to less. The threshold for an earlier check isn’t published, and the AML policy leaves it to Shuffle’s “sole discretion”.
Shuffle’s homepage KYC pitch
The homepage calls Shuffle a “Crypto Casino Without Lengthy KYC” and says no lengthy verification is needed to get started. That is true of signing up, not of cashing out. The Terms, the agreement you accept, still check your ID before your first withdrawal.
How long does Shuffle KYC take?
Only one Shuffle page gives a time. Its Canadian-dollar guide says the team wraps up an ID review “in just a few minutes”. While a check is open, Shuffle can restrict your access, payments and withdrawals until it is satisfied (Terms §5.1). Read Shuffle’s verification article
Shuffle account rules and AML checks
- One account per person. A household, device, IP address or payment method you share with another account holder must be reported (Terms §4.1, §4.3).
- Linked accounts need written approval first.
- Your wallet address is screened against sanctions lists before you get a deposit address.
- Every crypto deposit and withdrawal goes through Chainalysis.
- Not published
- Set by risk, at Shuffle’s “sole discretion” (AML policy)
- No article
- “A few minutes”
- Canadian-dollar guide only
- Access can be restricted
- Access, payments and withdrawals, until Shuffle is satisfied (Terms §5.1)
1At registration
18, or the legal age of majority for gambling where you are located (Terms §3.3a, §6.1a)
A username, email and date of birth open an account. A fiat payment method may need your full legal name and home address first.
2Before your first withdrawal
A government ID check, every time
Shuffle checks a valid government-issued identity document at a threshold it sets from time to time “and in any event before your first withdrawal” (Terms §5.2)
3Level 2 and Level 3 documents
Proof of identity, then proof of address
Level 2: a passport, an ID card or driver’s license (both sides), or a residence permit, as an original color photo valid for at least 3 months. Screenshots and digital documents are refused. Level 3: a utility, cable or landline bill, bank or card statement, tax bill, mortgage statement, lease, voter registration, government letter or employer’s certificate, most under 3 months old.
4If verification fails
Deposits back, winnings at risk
If Shuffle can’t verify your identity or age, it may close the account, return verified deposits to their source minus permitted deductions, and forfeit any winnings (Terms §5.6)
Shuffle withdrawals: what has to happen before you cash out?
Deposit rollover for everyoneBefore a Shuffle withdrawal, you have to wager 100% of every deposit, bonus or not (Terms §10.2). The one exception is crypto sent back to the exact wallet and network it came from. Crypto minimums, fees and confirmations sit behind the cashier screen, which you only see with an account.
How fast are Shuffle withdrawals?
Shuffle’s homepage says 90% of crypto withdrawals complete in under a minute. That is its own claim: Terms §7.2 warrants no processing time, and our real-money tests are coming soon.
Shuffle Canadian-dollar withdrawals
Canadian players can withdraw CAD by Interac e-Transfer in instant to 30 minutes, from $5 to $10,000 a transaction, with no Shuffle fee. A CAD withdrawal goes only to an account you’ve deposited from before, in your own name.
Which coin does a Shuffle withdrawal go out in?
The coin you deposited. Terms §10.3 sends a withdrawal out in the currency of the deposit it comes from. You can use another method if the receiving account is in your name, but Shuffle can insist on the deposit method and split a payout across the methods you used.
Shuffle deposit bonuses
Shuffle no longer publishes a standing welcome offer, and its homepage says deposit bonuses “rotate regularly”. The Deposit Bonus Terms set the method: (deposit + bonus) × a multiple each promotion names, progress weighted by house edge, a $10 max bet and 30 days to finish. A $10 bet on a 1%-edge game adds $2.50 of progress, by Shuffle’s own example.
Shuffle coins and currencies
Shuffle’s cashier lists 21 supported assets. In one week of the feed, players bet in 21 currencies, Shuffle’s own SHFL token included. 17 currencies carry a USD value on every bet, and USDT and SOL on all but one bet each. SHFL and BONK carry none. All 22,039 bets without a USD value are summed only inside their own token.
Shuffle wrong-chain deposits and liability cap
- Wrong-chain deposits: Recovery attempted above $20. The first time is free. After that, the penalty is 10%, capped at $20. An unsupported coin or chain can cost up to 50% of the deposit or be lost.
- Liability cap: The lowest of your balance, your deposits over the past 12 months, or USD 100 (Terms §16.3). Shuffle says it keeps player funds apart from operating funds (§11.1) and pays no interest on balances (§11.5).
Our real-money tests are coming soon.
- Wager 100% of the deposit
- Terms §10.2. Waived if the crypto goes back to the same wallet on the same network.
- Cashier only
- Crypto minimums show in the cashier (Terms §9.4, §10.6). CAD by Interac starts at $5.
- No fixed count
- It “depends on the wallet you are sending funds to”
- 90% under a minute
- Shuffle’s homepage claim for crypto. Terms §7.2 warrants no time.
- Discretionary
Shuffle bets and pricing by currency
The eight busiest currencies are shown, and 13 more appear with smaller volumes. A same-token ratio is a token’s payouts over its own stake, never converted to USD. Compare rows, but never add them up.
Shuffle rakeback, bonuses and VIP: what are they worth?
Ladder published in fullShuffle publishes more of its VIP program than most crypto casinos:
- Over 50 levels with exact XP thresholds
- 1 XP per $1 wagered on casino games
- Rakeback of 5% of the house edge of the games you play, returned as cash
- A level-up bonus priced for every rank up to Diamond
How much is Shuffle rakeback worth?
Wager 1,000 USDT on a game with a 2% house edge and you get 1 USDT back, win or lose (Shuffle’s own example). That is 0.1% of turnover. The rate moves with the game’s edge, not with how much you bet.
Shuffle level-up bonuses
Shuffle prints the wagering and the bonus side by side for every rank up to Diamond. Diamond 1 takes $17,000,000 of casino wagering and pays a level-up bonus of about $9,360, roughly 0.055% of turnover. Gold 1 works out at about 0.08%. These are level-up bonuses only. Rakeback, daily, weekly, monthly and reload bonuses come on top, and Shuffle doesn’t publish their sizes. Read Shuffle’s level-up table
Shuffle VIP ranks in the bet feed
60 aliases in the top band staked $12.8M in one week, 28.93% of everything bet under a visible name. The feed stamps a VIP label on every bet placed under a visible alias. Shuffle’s 46 labels are folded into its published rank families, so no small top tier can be singled out. Each label is the rank shown when the bet was placed, not an account status we verified.
SHFL token perks
Shuffle says betting in SHFL boosts your VIP bonuses and gives you free perpetual entry to the SHFL Lottery and a bigger share of future airdrops. SHFL is also one of two currencies the feed doesn’t price (BONK is the other). Its 21,965 bets, 3.94% of the capture, sit outside every USD total.
What Shuffle doesn’t publish about VIP
Shuffle publishes what each rank costs, but not what each rank earns.
- Rakeback by tier: Not published
- Weekly and monthly bonus formula: Not published. Based on wagered amount, house edge and profit over the period.
- Reload amounts: Not published. Listed by rank, with no figures.
- SHFL supply, burn and buyback: Not verified. The SHFL docs site returned no readable text when we checked on Sep 8, 2026.
- 5% of the house edge of the games you play, returned as cash
- From Bronze, after $1,000 wagered. Not on sports bets.
- 00:00 UTC
- From Bronze, issued daily at 00:00 UTC based on the previous 24 hours wagered
- Thursday, 11:00 UTC
- From Silver, issued every Thursday at 11:00 UTC and added to the VIP page
- 1 XP per $1 wagered
Shuffle bets, aliases and stake by VIP rank family
VIP labels exist only on bets with a visible name. An alias that leveled up mid-week shows up in two rows, so never total the alias column. All 9 families are in the bet data.
Shuffle games: what gets played most?
Shuffle’s feed logged 3,192 game titles. 17 Shuffle Originals took 60.54% of captured bets, and 3,177 third-party titles from 47 unnamed provider channels took the rest.
Are Shuffle Originals provably fair?
Yes. Shuffle Originals use a committed server seed, a player-controlled client seed and an incrementing nonce, combined with HMAC-SHA256. You can rotate seeds, and any bet can be re-checked on the verification page.
Shuffle Originals vs third-party games
17 in-house games took more bets than 3,177 third-party titles combined. Originals took 60.54% of bets and 46.88% of stake. The 3,177 third-party titles took 39.46% of bets and 53.12% of stake.
Game providers in the Shuffle feed
The feed carries 47 opaque provider keys and no studio names. We count the keys and don’t guess who they are.
Most played Shuffle games
Keno led the Originals on bets, with 105,899. Blackjack led on money, with $22,878,202 staked over 36,696 bets. Among third-party games, Mega Roulette led on money at $5,573,911.
Shuffle bets and stake by game category
Unclassified covers 659 titles with no source category. A small category can hinge on one big payout, so treat each ratio as one week’s result. All 10 categories are in the bet data.







What responsible gambling tools does Shuffle offer?
Policy contradicts itselfShuffle offers wager and loss limits, with a one-day cooling-off before any change, and self-exclusion from 1 day to permanent. There is no deposit limit, session limit or time-out, though the homepage lists “session time limits” among Shuffle’s tools. The policy also calls self-exclusion both impossible to lift and self-lifting unless you reconfirm by email.
Can you undo Shuffle self-exclusion?
Shuffle’s policy gives two answers. Section 5 says the account can’t be re-enabled for any reason during an exclusion. Section 6 says a request starts a 24-hour cooldown, then an email asks you to extend it. If you don’t within 24 hours, “your account will be unrestricted”. Read Shuffle’s responsible gambling policy
Shuffle’s responsible gambling page and the missing email
On Sep 8, 2026, and again on Oct 4, 2026, the responsible gambling page told players to contact support “at .” The email address was missing in three places on that page, and once on the license page. The address is support@shuffle.com.
Withdrawals during a Shuffle cooling-off
Terms §10.10 says no responsible gambling measure can be used to block or delay a legitimate withdrawal, and your funds stay available during a cooling-off. The responsible gambling policy (October 2024) is nearly two years older than the Terms (September 2026).
- Version 2.0, September 2026
- Version 1.1, October 2024
- Stay open (Terms §10.10)
Shuffle’s player controls and what to watch out for
Our tests of these tools are coming soon.
Shuffle complaints: what can you do if something goes wrong?
No route past supportTo complain, contact Shuffle by live chat or at support@shuffle.com, and keep every message and transaction hash. Past support, the route breaks in two places. The Complaints Handling Procedures the Terms depend on aren’t published anywhere we could find. The regulator the Terms escalate to says on its own site that it doesn’t resolve player disputes. No Shuffle document names an ADR body, mediator or arbitrator, and Shuffle publishes no complaint form.
Shuffle’s compliance seal: complaints@xcm.cw
The XCM seal in Shuffle’s footer sends complaints to complaints@xcm.cw once you can show you’ve exhausted Shuffle’s own procedure. XCM is Shuffle’s compliance manager, not an ADR body, and no Shuffle document says what it does with a complaint.
Does the Curaçao Gaming Authority handle Shuffle complaints?
No. Shuffle’s Terms send unresolved complaints to the Curaçao Gaming Authority, but the Authority says it doesn’t handle individual complaints against gaming providers.
- What Shuffle says: An unresolved complaint can go to the Curaçao Gaming Authority (Terms §18.2). Terms §18 also promises an acknowledgment and a full response “within the timelines set out in those Procedures”, and those Procedures aren’t published. Read Terms §18
- What the regulator says: The Curaçao Gaming Authority’s own online-gaming page states: “the CGA does not handle individual complaints against gaming providers. Resolving disputes between players and gaming operators is not within our mandate. As such, we do not have the authority to mediate or arbitrate in these matters. The CGA is not a civil court and cannot order gaming operators to compensate players or issue judgments.” The same page still invites complaints as supervisory intelligence (“a complaint or a pattern of complaints indicates a possible violation of the law”). It says a standard claim form is being built, and it won’t disclose the status of any investigation. Read the Authority’s own page
A complaint to the Authority may feed its supervision, but it won’t get your balance back, and the Authority won’t tell you what came of it.
Shuffle bet disputes and inactive accounts
- A dispute over what a bet was is settled by Shuffle’s own records (Terms §12.5).
- After 24 months of inactivity, Shuffle may email you. If you stay inactive for 3 more months, it may close the account and handle the balance under applicable law (§11.6).
- No dormancy fee is published.
- Messages about the service are kept for six years (§23.4).
- Closing your account is named as an option (§19.1), with no published way to ask for it.
- Not published
- Not published
- Terms §18.2 defers to the unpublished Procedures
- None named
- Coming soon
1Shuffle support
Live chat or support@shuffle.com
Save every message, timestamp and transaction hash. Any escalation needs them.
2The Complaints Handling Procedures
Referenced twice in Terms §18 and not published anywhere we could find
Plain text in Terms §18, not a link. The URL shuffle.com/info/complaints returned an empty page on Sep 8 and Oct 4, 2026, and the help center has no complaints article.
3Refer it to the regulator
The Curaçao Gaming Authority (Terms §18.2)
The only escalation Shuffle names, and no ADR provider, mediator or arbitrator appears in the Terms.
4Curaçao law, one claim at a time
Curaçao law (Terms §20.1)
Terms §20.3 requires claims to be brought individually and waives any class or representative action and, where applicable, a jury trial
What public Shuffle bet data did we analyze?
We captured 557,743 settled bets from 168 hours of Shuffle’s public feed. 535,704 carried a USD value and paid back 99.63% of stake. That is a feed ratio, not a game’s RTP. The other 22,039 bets carried no USD value at all.
How much the biggest Shuffle wins moved the result
Just 100 of 535,704 priced bets carried 10.96% of everything the feed paid out. Take out those 100 biggest payouts, 0.019% of bets, and the payout ratio moves from 99.63% to 91.85%. That is a 7.79-point move from a rounding error’s worth of bets.
Who placed the biggest Shuffle wins
77 of the 100 biggest payouts (77%) came from bets with a hidden identity, so they can’t be tied to an account. The other 23 carried a visible alias, from 3 different aliases. Together the group staked $4.3M and took back $13.9M. Across the whole capture, 16,027 visible aliases had a priced bet, and the top ten carried 13.77% of the stake.
What the Shuffle payout ratio doesn’t tell you
Neither ratio measures a house edge. Fair, high-variance games produce this kind of heavy payout tail over seven days, so treat 99.63% as one week’s result, not a trait of the casino.
Shuffle bets with no USD value
Every dollar figure here covers 96.05% of the capture, and Shuffle’s own token is most of the rest. 22,039 bets (3.95%) arrived with no USD value. We don’t invent an exchange rate for them, so they sit outside every stake, payout, net and ratio. Each one is summed inside its own token instead:
- SHFL: 21,965 bets. 11,127 hidden, same-token payout / stake 100.11%
- BONK: 72 bets. 10 hidden, same-token payout / stake 79.02%
- SOL: 1 bet. 0 hidden, same-token payout / stake 234.98%
- USDT: 1 bet. 0 hidden, same-token payout / stake 0.00%
Capture quality
The generator checks every row before a snapshot is built.
- Money-field failures: 0. Incomplete, negative or mismatched money, across the whole capture
- Duplicate bets: 0. 557,743 unique bets in 211,881 collection batches
- Empty hours: 1. 168 of 169 hours had at least one bet, and the longest gap was 2.77 hours
- Bets with no source category: 25,421. Labeled Unclassified, never guessed from the game title
- $127,198,449
- 535,704 priced bets
- $126,731,173
- Settled payouts in the same window
- -$467,276
- Net loss for the captured players
- 99.63%
- Feed ratio for this capture only
How the payout ratio moves as the biggest payouts come out of the priced bets
SHFL and BONK get no invented USD value. They are never added to each other or to the USD ledger, and no historical price is back-filled to make the totals look complete.
- 557,743
- 168
- 99.63% paid back
- Sep 16–23, 2026
Shuffle compared with similar casinos
All casinosSee how Shuffle stacks up against similar casinos on score, license, restricted countries and bet data.
| Casino | Score | License | Restricted | Bets captured | Feed payout ratio |
|---|---|---|---|---|---|
| Shuffle | 8.2 / 10 | Curaçao · checked | 19 territories | 557,743 | 99.63% |
 BC.Game BC.Game | 8.1 / 10 | Anjouan · checked | 27 territories | 581,645 | 93.95% |
 CoinCasino CoinCasino | 8.1 / 10 | Tobique · checked | 33 territories | 291,521 | n/a |
 Thrill Thrill | 8.0 / 10 | Anjouan · checked | 13 territories | 1,206,860 | 168.09% |
 Rakebit Rakebit | 8.0 / 10 | Anjouan · checked | 13 territories | 172,609 | n/a |
Our score
Is Shuffle legit? Yes, with a verified license, clear VIP rules and no published complaints procedure
Check the restricted list, wager each deposit in full before you cash out, and expect disputes to stop at Shuffle’s support.
- What Shuffle gets right: License, VIP ladder, rakeback, bet caps. The regulator’s certificate matches Shuffle’s documents, and every VIP threshold is published.
- Data behind this review: 557,743 public bets. 3,192 game titles over 168 hours.
- Main concern: No route past support. The complaints procedure isn’t published, and the regulator says it doesn’t resolve player disputes.
- Still to test: Withdrawals and self-exclusion. Our real-money tests are coming soon.
What could change this verdict
Four items are still open. Each is a test we haven’t run yet.
- Real-money withdrawal: Coming soon
- Account and KYC flow: Coming soon
- Responsible gambling tools: Coming soon
- Complaint route: Coming soon
In the public feed, players staked $127.2M in USD-priced bets over 168 hours. Just 100 bets paid out $13.9M, so any short-window figure at Shuffle rests on a handful of huge wins.
Who is Shuffle best for, and who should skip it?
- Players who want the rules in writing. Shuffle publishes its full VIP ladder, a rakeback formula with a worked example and per-game max bets, and its license checks out at the regulator.
- Originals players. 17 Shuffle Originals took 60.54% of captured bets. They are provably fair under a published HMAC-SHA256 scheme, backed by an iTech Labs RNG certificate.
- Multi-coin players. 21 currencies showed up in one week of the feed, and the cashier runs several coins on more than one network. A withdrawal goes out in the coin of the deposit it comes from (Terms §10.3).
- You want light KYC. The homepage pitches a “Crypto Casino Without Lengthy KYC”, but Terms §5.2 check your government ID before your first withdrawal in every case.
- You live in one of the 14 jurisdictions in Terms §8.3, such as Australia, France, Germany, the Netherlands, Portugal, Singapore, Spain, Sweden, the UK or the US. An open-ended catch-all adds more.
- You want a dispute route past the casino. The complaints procedure isn’t published, and the regulator says it doesn’t resolve player disputes.
- You need self-exclusion you can rely on. Shuffle’s policy calls it irreversible, then says it lapses unless you reconfirm by email within 24 hours.
- You want one clean payout figure. The feed paid back 99.63%, but 100 bets carried 10.96% of all payouts, and 3.95% of captured bets have no USD value.
Sources for this Shuffle review
Public bet feed
Public feed · USD-priced bets
- Bets captured
- 557,743
- Captured
- Sep 16–23, 2026
Operator documents (20)
- Curaçao license certificate (cert.cga.cw) · License
- Shuffle license page · License
- Terms of Service · License
- CGA online gaming license registry (PDF, Sep 8, 2026) · License
- Curaçao Gaming Authority license register page · License
- Curaçao Gaming Authority: online gaming · License
- XCM compliance seal, linked from the footer · License
- AML Policy · Restricted countries
- Help center: Canadian dollars · Restricted countries
- Help center: Level 2 verification · KYC
- shuffle.com homepage · KYC
- Privacy Policy · KYC
- Help center: where is my withdrawal · Withdrawals
- Help center: supported assets · Withdrawals
- Deposit Bonus Terms & Conditions · Bonuses
- Help center: how rakeback works · Bonuses
- Help center: level-up bonus · Bonuses
- Help center: the Shuffle VIP program · Bonuses
- Responsible Gaming and Self-Exclusion Policy · Complaints
- Help center: how Shuffle’s gambling limits work · Complaints
About this Shuffle review
Founder and author, 0xCasinos
Alex Savelle runs 0xCasinos and writes everything on it. Since July 12, 2026, Alex has captured 210 million bets from the public feeds of 24 crypto casinos. Alex turns that data into the reviews, rankings and studies on this site.
When a review covers a casino’s rules, Alex reads its terms, help center and license record first. Every document behind a claim is linked, and a review built from the bet feed alone says so. The numbers come from the captured feeds. The casino rules come from the casino’s own documents, dated the day they were read.
- Documents re-read. Shuffle’s first-deposit bonus article now returns a 404, and the Deposit Bonus Terms that replaced it leave the WR to each promotion. The homepage now sells a “Crypto Casino Without Lengthy KYC”, while the Terms still check your ID before your first withdrawal. A new Interac guide covers CAD deposits and withdrawals, the license certificate lists 41 related domains, and the footer’s compliance seal sends complaints to complaints@xcm.cw. The page gained a Withdrawals tab.
- Data refreshed. Every feed figure now comes from the Sep 16 to Sep 23 window: 557,743 bets over 168 hours, 22,039 of them without a USD value.
- First published. 28 sources read at their own address, including the Curaçao Gaming Authority certificate and the Authority’s own statement on player complaints, plus a 168-hour capture of 582,437 bets. The regulator-naming conflict, the self-exclusion conflict, the missing complaints procedures and the unpriced-token gap were all recorded that day.
Shuffle bonus: rakeback at 5% of house edge, rotating offers, and no published WR
Shuffle pays rakeback at 5% of the house edge on casino bets, from Bronze, and a level-up bonus that runs from about $0.90 at Bronze 1 to about $9,360 at Diamond 1. There’s no standing welcome offer. Deposit bonuses rotate, and each one names its own multiple. The Deposit Bonus Terms give only the method, (deposit + bonus) × that multiple, and use 35x as a worked example.
- October 4, 2026
- 5
- 5 of 8
Published rules only
We haven’t claimed a bonus at any casino. Every rule below is the casino’s own, linked to its source.
Shuffle bonuses FAQ: what people ask, answered up front
Quick answers from Shuffle’s own bonus terms.
How does Shuffle work out the WR on a deposit bonus?
Your eligible deposit plus the bonus, times the multiple the promotion names. In Shuffle’s own example, a $100 deposit with a $100 bonus at 35x needs $7,000 of qualifying wagers. Each bet counts at its size × (edge ÷ 4%), so $10 at a 1% edge adds $2.50.
See the row it came from →Which games count toward a Shuffle bonus?
Only eligible Originals, slots, sportsbook markets and live casino games. Accumulator games, challenges, slot bonus buys and Shuffle’s Restricted Games list are barred, and sports bets need decimal odds of 1.30 or more.
See the row it came from →Is there a max win on a Shuffle bonus?
There can be. A promotion can cap the profit you keep at a multiple of your deposit. You see the cap before you claim, and anything above it is deducted when the wagering is done.
See the row it came from →When does Shuffle pay its daily, weekly and monthly bonuses?
The daily bonus lands at 00:00 UTC once you reach Bronze, based on your last 24 hours of wagering. The weekly bonus comes every Thursday at 11:00 UTC from Silver, and the monthly one follows your recent wagers. Shuffle publishes no size for any of them.
See the row it came from →Does a Shuffle deposit bonus cut your VIP rewards?
It can. VIP rewards may be reduced while a deposit bonus is active, by an amount each promotion states. Until the WR is met or forfeited, you also can’t withdraw in the bonus currency, move funds to the Vault, tip or count the wagering toward another code.
See the row it came from →
Shuffle bonus offer, wagering and expiry: the key rules
- Named, never stated
No standing welcome offer is published. The homepage says deposit bonuses “rotate regularly”, and each one’s percentage, cap and minimum deposit are shown only in its promotion.
- Named, never stated
Set by each promotion. The terms publish the method, (eligible deposit + bonus) × the multiple, and use 35× only as a worked example.
- Published
Wagering must be completed within 30 days of the bonus being credited, unless the promotion says otherwise. After that, the bonus and its winnings may be removed.
Shuffle bonus terms: every rule, row by row
Every Shuffle bonus rule, with its clause and source.
The offer
The headline offer, the minimum deposit and the rakeback rate.
Bonus offer
What bonus does Shuffle offer?
- Named, never stated
No standing welcome offer is published. The homepage says deposit bonuses “rotate regularly”, and each one’s percentage, cap and minimum deposit are shown only in its promotion.
Source: Deposit Bonus Terms & Conditions
Minimum deposit
What is the minimum deposit for a Shuffle bonus?
- Named, never stated
Shown in each promotion, not in the general terms.
Source: Deposit Bonus Terms & Conditions
Rakeback or reward rate
What rakeback rate does Shuffle pay?
- Published
5% of the house edge of the games you play, returned as cash
Shuffle’s own example: 1,000 USDT wagered on a game with a 2% house edge returns 1 USDT, win or lose. In that example, the return is 0.1% of turnover. The rate moves with the house edge of the game, not with the amount wagered. No per-tier rakeback percentage, bonus percentage or reload amount is published.
Source: Help center: how rakeback works
Wagering requirements
The WR, game contribution and the max bet while you wager.
Wagering requirement
What is the Shuffle bonus wagering requirement?
- Named, never statedDeposit Bonus T&Cs §3
Set by each promotion. The terms publish the method, (eligible deposit + bonus) × the multiple, and use 35× only as a worked example.
Shuffle’s own example: a $100 deposit with a $100 bonus at 35× needs $7,000 of qualifying wagers.
Source: Deposit Bonus Terms & Conditions
Game contribution
Which games count toward the Shuffle WR?
- PublishedDeposit Bonus T&Cs §4
Wager amount × (game edge ÷ 4%) = wagering progress, unless the promotion says otherwise.
Shuffle’s own example: a $10 wager on a game with a 1% house edge adds $2.50 of progress.
Source: Deposit Bonus Terms & Conditions
Max bet while wagering
What is the max bet on a Shuffle bonus?
- PublishedDeposit Bonus T&Cs §5, §6
$10 USD equivalent per wager while a deposit bonus is active, unless the promotion says otherwise.
Sportsbook bets need decimal odds of 1.30 or more unless the promotion says otherwise, and void, cashed-out or opposing bets don’t count.
Source: Deposit Bonus Terms & Conditions
What you can keep
The max cashout, the expiry and what voids the bonus.
Max cashout
Is there a max cashout on Shuffle bonuses?
- Named, never statedDeposit Bonus T&Cs §12
A promotion can cap the profit you keep at a multiple of your deposit. The cap shows before you claim, and anything above it is deducted when the wagering is done.
Source: Deposit Bonus Terms & Conditions
Bonus expiry
When does a Shuffle bonus expire?
- PublishedDeposit Bonus T&Cs §3, Terms §13.8
Wagering must be completed within 30 days of the bonus being credited, unless the promotion says otherwise. After that, the bonus and its winnings may be removed.
A bonus not claimed within its claim period, or within 60 days, may be canceled, and Shuffle may remove a bonus from an inactive account (Terms §13.8, Deposit Bonus T&Cs §3). A bonus balance is not withdrawable until wagering is met and, per Terms §13.6, is not held as player funds or owed to you until it converts.
Source: Deposit Bonus Terms & Conditions
Forfeiture rules
What voids a Shuffle bonus?
- PublishedDeposit Bonus T&Cs §7, §9
You can ask support to forfeit a deposit bonus at any time. Before play, only the bonus goes. After play starts, the bonus and its winnings go and the rest of your deposit is released.
If you self-exclude, take a cooling-off period or ask to close the account mid-wagering, you can forfeit the bonus and withdraw the rest, minus the bonus and its winnings.
Source: Deposit Bonus Terms & Conditions
VIP program
VIP tiers, reward timing and what’s blocked while a WR is live.
VIP tiers
What are the Shuffle VIP tiers?
- Published
Over 50 levels, published with exact XP thresholds: Silver: 10,000 XP · Gold: 100,000 XP · Platinum: 450,000 XP · Jade: 1,200,000 XP · Sapphire: 2,300,000 XP · Ruby: 5,800,000 XP · Diamond: 17,000,000 XP · Opal: 90,000,000 XP · Dragon: 340,000,000 XP · Mythic: 1,000,000,000 XP · Dark: 5,000,000,000 XP · Legend: 10,000,000,000 XP.
Casino betting earns 1 XP per $1 wagered. Sports, e-sports and novelties earn 3 XP per $1 on odds of 1.1 or greater. Published level-up bonuses: Bronze 1: $1,000 / Approx. $0.9 · Silver 1: $10,000 / Approx. $9 · Gold 1: $100,000 / Approx. $80 · Platinum 1: $450,000 / Approx. $260 · Jade 1: $1,200,000 / Approx. $260 · Sapphire 1: $2,300,000 / Approx. $900 · Ruby 1: $5,800,000 / Approx. $2,700 · Diamond 1: $17,000,000 / Approx. $9,360. These are the level-up bonuses only. Rakeback, daily, weekly, monthly and reload bonuses are separate and their sizes are not published, so the level-up table isn’t the full value of the VIP program.
Source: Help center: level-up bonus
When rewards land
How often does Shuffle pay rewards?
- Published
From Bronze, issued daily at 00:00 UTC based on the previous 24 hours wagered. From Silver, issued every Thursday at 11:00 UTC and added to the VIP page. Issued monthly based on recent wagers and added to the VIP page.
The weekly and monthly bonuses are calculated from wagered amount, the house edge of the games played and profit values over the period. The three inputs are published, but the formula is not. Rakeback is not available on sports bets, and it starts from Bronze, reached after $1,000 of total wagering.
Blocked while wagering
What can’t you do while a Shuffle bonus is active?
- PublishedDeposit Bonus T&Cs §6, §7, §8
Accumulator games, challenges, slot bonus buys and anything on Shuffle’s Restricted Games list are barred. Only eligible Originals, slots, sportsbook markets and live casino games count.
Withdrawing in the bonus currency, moving funds to the Vault, tipping and using the wagering toward another bonus code are blocked until the wagering is done or the bonus is forfeited. VIP rewards may be reduced while a deposit bonus is active, by an amount each promotion states.
Source: Deposit Bonus Terms & Conditions
Eligibility and deposit rules
Who is eligible, and the deposit rule that applies even with no bonus.
Bonus abuse and eligibility
When can Shuffle take a bonus back?
- PublishedTerms §3.7, §3.8
Terms §3.7 and §3.8 allow removal of bonuses and winnings for bonus stacking, hedging across accounts, bots or exploiting bugs.
Source: Terms of Service
Deposit playthrough
Do you have to wager a Shuffle deposit with no bonus?
- PublishedTerms §10.2
You must wager 100% of the value of a deposit before withdrawing funds attributable to it.
It does not apply to a digital-asset withdrawal sent back to the same wallet address, on the same network, as the corresponding deposit.
Source: Terms of Service
This deposit rule also applies to cashouts. See Shuffle withdrawal rules
Shuffle bonus sources: every document behind this tab
5 documents, checked on October 4, 2026. Any of them can change without notice.
- Deposit Bonus Terms & Conditionshttps://shuffle.com/info/deposit-bonus-tcs
- Help center: how rakeback workshttps://help.shuffle.com/en/articles/10020509-how-does-rakeback-work
- Help center: level-up bonushttps://help.shuffle.com/en/articles/8528228-shuffle-level-up-bonus
- Help center: the Shuffle VIP programhttps://help.shuffle.com/en/articles/9996771-the-shuffle-vip-program
- Terms of Servicehttps://shuffle.com/info/terms
- 5
- 3
- 0
- 0
The eight core questions: offer, WR, expiry, rakeback rate, game contribution, max bet, max cashout and forfeiture. “Named, never stated” means Shuffle says the rule exists but prints no figure on a public page. “Not published” means Shuffle says nothing. “Not checked by us” is our gap.
Shuffle withdrawal time: 90% land in under a minute, by Shuffle’s own homepage
Shuffle’s homepage says 90% of crypto withdrawals complete in under a minute, while Terms §7.2 warrants no processing time at all. First you wager 100% of each deposit, unless the crypto goes back to the wallet and network it came from (§10.2). Crypto fees and minimums show only in the cashier. Canadian players get Interac withdrawals in 30 minutes or less, from $5 to $10,000 a transaction, with no Shuffle fee.
- October 4, 2026
- 5
- 5 of 8
Real-money withdrawal tests: coming soon
Our real-money withdrawal tests are coming soon. Every figure below is the casino’s own published rule, linked to its source.
Shuffle withdrawals FAQ: what people ask, answered up front
Quick answers from Shuffle’s own cashier rules.
Does Shuffle charge a withdrawal fee?
Terms §10.7 lets Shuffle charge one, shown before you confirm, and no fee table is published. The homepage lists only a “Small network fee, varies by coin”, typically under $1, and CAD withdrawals carry no Shuffle fee.
See the row it came from →What is the minimum withdrawal at Shuffle?
Shuffle shows it in the cashier when you request a withdrawal (Terms §10.6), so no crypto figure is published. For CAD by Interac, the minimum is $5 and the maximum $10,000 per transaction.
See the row it came from →Can you withdraw Shuffle winnings in a different coin?
No. Terms §10.3 sends a withdrawal out in the currency of the deposit it comes from. You can use another method if the account is in your name, but Shuffle can insist on the deposit method and split a payout across the methods you used.
See the row it came from →How long do CAD withdrawals take at Shuffle?
Instant to 30 minutes by Interac e-Transfer, by Shuffle’s Canadian-dollar guide, with no Shuffle fee. They go only to an account you’ve deposited from before, and it has to be in your own name.
See the row it came from →
Shuffle withdrawal fee, time and wagering: the key rules
- Named, never stated
Terms §10.7 reserves the right to charge a withdrawal fee, shown before you confirm, but no fee schedule is published
- Published
The homepage FAQ says “90% of all crypto withdrawals at Shuffle are completed in under one minute”, and the Canadian-dollar guide gives instant to 30 minutes for Interac.
- Published
You must wager 100% of the value of a deposit before withdrawing funds attributable to it
Shuffle withdrawal terms: every rule, row by row
Every Shuffle withdrawal rule, with its clause and source.
Withdrawal fees
The casino fee, the network fee and any charge for withdrawing too often.
Withdrawal fee
Does Shuffle charge a withdrawal fee?
- Named, never stated
Terms §10.7 reserves the right to charge a withdrawal fee, shown before you confirm, but no fee schedule is published
The homepage lists the withdrawal fee as a “Small network fee, varies by coin” and says fees stay “typically under $1”. Shuffle charges nothing for CAD deposits or withdrawals, though your bank may charge for an e-Transfer.
Source: Terms of Service
Network fee
Who pays the network fee at Shuffle?
- Published
The blockchain fee is deducted from the amount withdrawn and is set by the network, not by Shuffle (Terms §10.16)
Source: Terms of Service
How often you can withdraw
How many withdrawals a day does Shuffle allow?
- Not published
No limit on the number of withdrawals per day is published.
Checked in: Terms of Service
Withdrawal time
The processing time the casino states and the confirmations it waits for.
Processing time
How long do Shuffle withdrawals take?
- PublishedTerms §7.2, §10.12
The homepage FAQ says “90% of all crypto withdrawals at Shuffle are completed in under one minute”, and the Canadian-dollar guide gives instant to 30 minutes for Interac.
Terms §7.2 warrants no processing time, and §10.12, on fiat withdrawals, calls any time Shuffle publishes “indicative only”.
Source: shuffle.com homepage FAQ
Confirmations
How many network confirmations does Shuffle need?
- Not published
No fixed confirmation count is published. The help center says the number “depends on the wallet you are sending funds to”
Checked in: Help center: where is my withdrawal
Withdrawal limits
The minimum, the maximum and what happens to a win too big to pay at once.
Minimum withdrawal
What is the minimum withdrawal at Shuffle?
- Named, never stated
Not published. Terms §10.6 says the minimum is shown in the cashier at the time of the request
CAD by Interac: $5 minimum and $10,000 maximum per transaction, for CAD deposits and withdrawals alike.
Source: Terms of Service
Withdrawal limit (CAD)
Is there a withdrawal limit or max payout at Shuffle?
- Published
No limit is published for crypto withdrawals. CAD withdrawals by Interac cap at $10,000 per transaction.
Source: Help center: Canadian dollars
Big wins paid in installments
Does Shuffle pay big wins in installments?
- Not published
No rule on paying large wins in installments is published.
Checked in: Terms of Service
Coins and networks
The coins and networks the casino pays out on.
Withdrawal coins
Which coins can you withdraw from Shuffle?
- Published
21 assets: BTC, ETH, SHFL, CASH, LTC, USDT, USDC, TRX, POL, XRP, SOL, DOGE, BNB, AVAX, GRAM, SHIB, BONK, WIF, TRUMP, PUMP, DAI
Source: Help center: supported assets
Payout networks
Which networks does Shuffle pay out on?
- Published
Several assets run on more than one network. USDT runs on ERC20, BEP20, TRC20, POL and SOL. USDC runs on ERC20, BEP20, SOL, POL, Base and ARB. ETH runs on BEP20, Base and Robinhood Chain, and SHFL on ERC20 only.
Source: Help center: supported assets
Before you cash out
What stands between your balance and a payout: wagering, KYC and where the money can go.
Deposit playthrough
Do you have to wager your deposit before withdrawing from Shuffle?
- PublishedTerms §10.2
You must wager 100% of the value of a deposit before withdrawing funds attributable to it
It does not apply to a digital-asset withdrawal sent back to the same wallet address, on the same network, as the corresponding deposit
Source: Terms of Service
KYC and holds
What can delay Shuffle withdrawals?
- Published
Terms §10.1 lists four conditions before a withdrawal is released: verified identity, a receiving account in your own name, any further information requested, and the wagering requirement met
Shuffle checks a valid government-issued identity document at a threshold it sets from time to time “and in any event before your first withdrawal” (Terms §5.2)
Source: Terms of Service
Withdrawal destination
Can you withdraw to a different wallet at Shuffle?
- PublishedTerms §10.3, §10.15
A withdrawal goes out in the currency of the deposit it comes from. You may use a method other than the deposit’s if the receiving account is in your own name, but Shuffle can require the deposit method for AML, fraud or sanctions reasons, and can split a withdrawal across the methods you deposited with (Terms §10.3).
Crypto withdrawals go to the wallet address and network you specify, and one sent to a wrong address or network may be lost (Terms §10.15). CAD withdrawals go only to an account you have deposited from before, and the bank account must be in your own name.
Source: Terms of Service
Shuffle withdrawal sources: every document behind this tab
5 documents, checked on October 4, 2026. Any of them can change without notice.
- Terms of Servicehttps://shuffle.com/info/terms
- shuffle.com homepage FAQhttps://shuffle.com/
- Help center: where is my withdrawalhttps://help.shuffle.com/en/articles/6941175-where-is-my-withdrawal
- Help center: Canadian dollarshttps://help.shuffle.com/en/articles/16879186-how-to-deposit-and-withdraw-in-canadian-dollars
- Help center: supported assetshttps://help.shuffle.com/en/articles/6966242-assets-supported-for-deposits-and-withdrawals
- 5
- 2
- 1
- 0
The eight core questions: fee, processing time, deposit playthrough, minimum, maximum, coins, networks and confirmations. “Named, never stated” means Shuffle says the rule exists but prints no figure on a public page. “Not published” means Shuffle says nothing. “Not checked by us” is our gap.
Shuffle withdrawals compared: how its cashier rules stack up
Shuffle answers 5 of the 8 core questions. Across the 23 casinos with a withdrawals tab, the range is 3 to 8. Each card shows how every casino answers one question, and every name links to that casino’s withdrawals tab.
Withdrawal fee
15 of the 23 publish an answer.
Processing time
20 of the 23 publish an answer.
Deposit playthrough
21 of the 23 publish an answer.
Minimum withdrawal
10 of the 23 publish an answer.
“Not checked by us” is our gap, and it never counts against a casino.
Shuffle KYC: sold as light on the homepage, an ID check before your first withdrawal
Shuffle’s homepage pitches a “Crypto Casino Without Lengthy KYC”, but its Terms check your government-issued ID before your first withdrawal, or sooner at a threshold it sets from time to time (§5.2). The AML policy ties that threshold to risk “according to Shuffle’s sole discretion”. Level 2 takes an original color photo of a passport, ID card, driver’s license or residence permit, and screenshots are refused. The Canadian-dollar guide says a review takes “just a few minutes”.
- October 4, 2026
- 6
- Advertises no-KYC or minimal KYC
- 6 of 6 core questions
Where a casino’s marketing and its terms disagree, the terms bind you. Every rule here is the casino’s own, not legal or financial advice.
Our ID-check tests are coming soon. Each rule is dated and linked to its source, and casinos can change them without notice.
Shuffle KYC FAQ: what people ask, answered up front
Quick answers from Shuffle’s own KYC rules.
Can you withdraw from Shuffle without verifying?
No, not the first time. Shuffle checks a government-issued ID at a threshold it sets from time to time “and in any event before your first withdrawal” (Terms §5.2). It doesn’t publish the threshold.
See the row it came from →Why might Shuffle reject a Level 2 document?
Because it’s a screenshot or a digital file. Shuffle wants an original color photo of a passport, ID card, driver’s license or residence permit, valid for at least three months. Most Level 3 proof of address documents must be under three months old.
See the KYC levels →What happens if Shuffle can’t verify you?
Shuffle can close the account, send verified deposits back to their source minus permitted deductions and forfeit any winnings (Terms §5.6). It can also ask where your money came from and restrict deposits, wagering or withdrawals until it’s assessed (§5.4).
See the row it came from →
Shuffle KYC: what it claims, what it requires and when it asks
Shuffle checks a valid government-issued identity document at a threshold it sets from time to time “and in any event before your first withdrawal” (Terms §5.2)
Shuffle reserves the right to ask for KYC documentation at any time
- Before a withdrawal
- At a published amount
- Any time, at the casino’s discretion
Shuffle KYC claim vs terms: before you sign up, and once you have
Both come from Shuffle, checked on October 4, 2026. The claim is what Shuffle tells new players. The terms are what you agree to, and they win where the two disagree.
“Crypto Casino Without Lengthy KYC”
The homepage adds “No lengthy verification process required to get started” and says streamlined onboarding “reduces the need to upload documents”, before allowing that “certain limits or additional checks may apply in specific cases”.
Published in shuffle.com homepage
Shuffle checks a valid government-issued identity document at a threshold it sets from time to time “and in any event before your first withdrawal” (Terms §5.2)
Source: Terms of Service
Why they differ: The homepage sells light KYC, while Terms §5.2 checks your ID before your first withdrawal in every case. Both are Shuffle’s own words, and the Terms are the agreement you accept.
Shuffle KYC levels: what each level asks for
Each Shuffle KYC level and what it asks for, exactly as Shuffle publishes them.
Shuffle publishes Levels 2 and 3. No Level 1 article is published in the English help center.
Shuffle KYC requirements: every rule, row by row
Every Shuffle KYC rule, with its clause and source.
Claim vs terms
What the casino says about KYC, what its terms require and when a check is triggered.
What the casino claims
What does Shuffle say about KYC before you sign up?
- Two answers
“Crypto Casino Without Lengthy KYC”
The other document: Shuffle checks a valid government-issued identity document at a threshold it sets from time to time “and in any event before your first withdrawal” (Terms §5.2)
The homepage sells light KYC, while Terms §5.2 checks your ID before your first withdrawal in every case. Both are Shuffle’s own words, and the Terms are the agreement you accept.
The homepage adds “No lengthy verification process required to get started” and says streamlined onboarding “reduces the need to upload documents”, before allowing that “certain limits or additional checks may apply in specific cases”.
Source: shuffle.com homepage and Terms of Service
What the terms require
What KYC does Shuffle require before it pays out?
- Published
Shuffle checks a valid government-issued identity document at a threshold it sets from time to time “and in any event before your first withdrawal” (Terms §5.2)
Source: Terms of Service
When KYC is triggered
When does Shuffle ask for KYC?
- PublishedTerms §5.1
Shuffle reserves the right to ask for KYC documentation at any time
- Before a withdrawal
- At a published amount
- Any time, at the casino’s discretion
No monetary threshold is published. The AML policy says a withdrawal threshold is set by risk characterization “according to Shuffle’s sole discretion”
Source: Terms of Service
What the check asks for
Accepted documents, KYC levels, the KYC provider and source of funds checks.
Accepted documents
What documents does Shuffle accept for KYC?
- Published
Passport, ID card (both sides), driver’s license (both sides) or residence permit, as an original color photograph, valid for at least 3 months. Screenshots and digital-format documents are refused
Proof of address: utility, cable or landline bill, bank or credit-card statement, tax bill, mortgage statement, lease, voter registration, government correspondence or employer’s certificate. Most must be under 3 months old
KYC levels
What are the Shuffle KYC levels?
- Published
Shuffle publishes Levels 2 and 3. No Level 1 article is published in the English help center.
KYC provider
Which KYC provider does Shuffle use?
- Not published
Shuffle names no KYC provider. Its AML policy says only that it “may utilise a third-party service provider” to check your details, and the one vendor it names, Chainalysis, screens wallets.
Checked in: AML Policy
Source of funds
Does Shuffle ask for source of funds?
- Published
Bank statements, payslips, tax records or evidence of an asset disposal may be required, with deposits, wagering or withdrawals restricted until assessed (Terms §5.4)
Source: Terms of Service
While KYC is pending
What you can do while a check is pending, and how long it takes. Most casinos on this site publish no review time.
Limits during a check
What can you do at Shuffle while KYC is pending?
- Published
Terms §5.1 allows access, payments and withdrawals to be restricted until identity is established to Shuffle’s satisfaction. Nothing more specific is published
Source: Terms of Service
Verification time (Canadian-dollar guide)
How long does Shuffle KYC verification take?
- Published
Shuffle’s Canadian-dollar guide says its team wraps up an ID review “in just a few minutes”. No other Shuffle document gives a time.
Source: Help center: Canadian dollars
If you fail or refuse
What happens if you don’t pass KYC, and what your account and wallet are screened against.
If you don’t verify
What happens if you fail or refuse KYC at Shuffle?
- Published
If Shuffle can’t verify your identity or age, it may close the account, return verified deposits to their source minus permitted deductions, and forfeit any winnings (Terms §5.6)
Source: Terms of Service
Sanctions, PEP and wallet screening
What does Shuffle screen your account and wallet against?
- Published
Wallet addresses are screened against sanctions databases before a funding address is issued, and every crypto deposit and withdrawal is run through Chainalysis
The AML policy lists players it will not onboard or will suspend, including those who conceal their location, are in a restricted jurisdiction, or “are addicted to gambling or have mental health issues”
Source: AML Policy
Age and document retention
The minimum age, and how long the casino keeps your documents.
Minimum age
How old do you have to be to play at Shuffle?
- Published
18, or the legal age of majority for gambling where you are located (Terms §3.3a, §6.1a)
Source: Terms of Service
Document retention
How long does Shuffle keep your documents?
- Not published
No retention period for KYC documents is published. The Privacy Policy keeps your data while you are a customer, then for the minimum time its purposes and the law require. Terms §23.4 keeps communications for six years.
Checked in: Privacy Policy
Shuffle KYC sources: every document behind this tab
6 documents, checked on October 4, 2026. Any of them can change without notice.
- Terms of Servicehttps://shuffle.com/info/terms
- Help center: Level 2 verificationhttps://help.shuffle.com/en/articles/16769451-level-2-verification
- Help center: Canadian dollarshttps://help.shuffle.com/en/articles/16879186-how-to-deposit-and-withdraw-in-canadian-dollars
- shuffle.com homepagehttps://shuffle.com/
- AML Policyhttps://shuffle.com/info/aml
- Privacy Policyhttps://shuffle.com/info/privacy
- 6
- 0
- 0
- 0
The six core questions: what the terms require, when KYC is triggered, accepted documents, limits during a check, verification time and what happens if you don’t verify. “Not published” means Shuffle says nothing. “Not checked by us” is our gap.
Shuffle KYC vs other casinos: how its rules compare
Shuffle answers 6 of the 6 core questions. Across the 24 casinos with a KYC tab, the range is 4 to 6. Each card shows how every casino answers one question, and every name links to that casino’s KYC tab.
What the terms require
All 24 answer this. A casino gets this tab only if it does.
- Published24
Shuffle 500 Casino, AceBet, BC.Game, BetFury, Chips, and 18 more
When KYC is triggered
All 24 answer this. A casino gets this tab only if it does.
Accepted documents
23 of the 24 publish an answer.
“Not checked by us” is our gap, and it never counts against a casino.
Shuffle KYC in the full comparison: every casino’s claim next to its terms
One table puts every casino’s KYC claim next to its terms and its triggers. It uses the same records as this tab.
No-KYC claims
Which casinos say “no KYC”, and what do their own terms require?
Every no-KYC claim, quoted and linked, next to the KYC rules in the same casino’s own terms.
Open the full comparison →Shuffle license: one number across four documents, two names for the regulator
OGL/2024/1337/0628 shows Active on the Curaçao Gaming Authority’s certificate (cert.cga.cw, rechecked October 4, 2026), granted October 16, 2024, with no clear expiry date. The certificate names Natural Nine B.V. (company number 160998) and shuffle.com, the same values four Shuffle documents print, and lists 41 more domains registered under it. The documents disagree only on the regulator’s name. Terms §1.1 and §18.2 say Curaçao Gaming Authority, and the license page and the AML policy say Curaçao Gaming Control Board. That matters because §18.2 is the clause that routes an unresolved complaint.
- October 4, 2026
- 7
- Checked at the regulator · Curaçao
- 6 of 6 core questions
A license record shows that the licensing relationship was on the regulator’s own record on the day we checked. It says nothing about a casino’s reserves, whether a withdrawal gets paid, how a dispute would end or whether playing is lawful where you live.
We haven’t contacted any regulator or filed a complaint. Every value is the record as it stood on the day we checked, linked so you can check it yourself. Registers and footers can change without notice.
Shuffle license FAQ: what people ask, answered up front
Quick answers from the regulator’s record and Shuffle’s own documents.
Does Shuffle’s license number match the Curaçao certificate?
Yes. OGL/2024/1337/0628 is on the certificate for shuffle.com and Natural Nine B.V., company number 160998, granted October 16, 2024. Shuffle’s terms, license page, privacy policy and AML policy all print the same company, number and license.
See the row it came from →What is Shuffle’s regulator called?
The Curaçao Gaming Authority, under two names. Terms §1.1 and §18.2 say Curaçao Gaming Authority, and the license page and AML policy say Curaçao Gaming Control Board. The regulator says the GCB is now referred to as the CGA under the LOK.
See every reading →Was Shuffle found in the Curaçao license register?
Not as a searchable entry. The authority publishes its register only as a dated PDF, so Shuffle’s license is checked on its certificate instead. An iTech Labs RNG certificate for Natural Nine B.V. also resolves, but that isn’t a license.
See what we couldn’t get →
Shuffle license: how it was checked, the number and the holder
The Curaçao Gaming Authority certificate for OGL/2024/1337/0628 resolved on cert.cga.cw on Sep 8, 2026, and again on Oct 4, 2026, and names Natural Nine B.V., company number 160998 and shuffle.com.
OGL/2024/1337/0628, returned by the certificate and printed identically in four Shuffle documents.
On the certificate: Natural Nine B.V. · Curaçao company number 160998. In Terms §1.1: Natural Nine B.V. · Curaçao Chamber of Commerce registration number 160998.
Checked at the regulator: Checked on the regulator’s own certificate, public register or seal validator. The number, holder and dates shown are the regulator’s, not the casino’s. Checking a Curaçao license: Certificates come from two hosts, cert.cga.cw and cert.gcb.cw, on a portal branded Curaçao Gaming Authority. Several certificates still name the Curaçao Gaming Control Board. A separate PDF license registry, published periodically, has a status column that varies between licensees.
Shuffle license record: every field, row by row
Every field on Shuffle’s license record, marked regulator or casino, with its source.
How the license was checked
The regulator record we checked, and what the license seal on the casino’s site shows.
Checked at the regulator
Where was Shuffle’s license checked?
- Checked at regulator
The Curaçao Gaming Authority certificate for OGL/2024/1337/0628 resolved on cert.cga.cw on Sep 8, 2026, and again on Oct 4, 2026, and names Natural Nine B.V., company number 160998 and shuffle.com.
Records checked: Curaçao certificate, cert.cga.cw.
License seal
What does Shuffle’s license seal or validator show?
- Checked at regulator
Opened from the regulator’s seal in Shuffle’s footer on Oct 4, 2026, the certificate still reads Active, granted 16/10/2024, for Natural Nine B.V. and shuffle.com.
The second seal in Shuffle’s footer is a commercial one from XCM, Shuffle’s compliance manager. Its page names Natural nine B.V., Korporaalweg 10 and support@shuffle.com, shows “Operating status: VALID” for shuffle.com, and sends complaints to complaints@xcm.cw once you’ve exhausted Shuffle’s own procedure.
License number and holder
The license number and company the casino prints, checked against the regulator’s record.
License number match
Does Shuffle’s license number match the regulator’s record?
- Checked at regulator
OGL/2024/1337/0628, returned by the certificate and printed identically in four Shuffle documents.
The terms, the license page, the privacy policy and the AML policy each name Natural Nine B.V., company number 160998 and license OGL/2024/1337/0628.
Source: Curaçao license certificate (cert.cga.cw) and Shuffle license page
License holder
Who holds Shuffle’s license?
- Checked at regulator
On the certificate: Natural Nine B.V. · Curaçao company number 160998. In Terms §1.1: Natural Nine B.V. · Curaçao Chamber of Commerce registration number 160998.
Incorporated in Curaçao in 2022 (AML policy §1 and privacy policy §1)
Source: Curaçao license certificate (cert.cga.cw) and Terms of Service
Dates, domains and type
Issue and expiry dates, licensed domains and license type, as the record shows them. A date on a register isn’t a ruling on the license.
Issue and expiry dates
When does Shuffle’s license expire?
- Checked at regulator
Granted October 16, 2024, per the Curaçao certificate. The certificate shows a grant date and no clear expiry date.
Status printed on the certificate: Active.
Licensed domains
Which domains does Shuffle’s license cover?
- Checked at regulator
shuffle.com, the certificate’s primary domain, plus 41 active related domains registered under it.
The certificate lists these as “Active related domains” registered under shuffle.com. Ten of them are numbered disorder domains, from disorder1.com to disorder11.com. The full list: disorder1.com, disorder10.com, disorder11.com, disorder2.com, disorder4.com, disorder5.com, disorder6.com, disorder7.com, disorder8.com, disorder9.com, shuffle.ag, shuffle.bet, shuffle.blue, shuffle.casino, shuffle.club, shuffle.digital, shuffle.game, shuffle.gg, shuffle.global, shuffle.gold, shuffle.money, shuffle.net, shuffle.online, shuffle.red, shuffle.site, shuffle.vegas, shuffle.vip, shuffle.企业, shuffle1060.com, shuffle1061.com, shuffle1062.com, shuffle1063.com, shuffle1064.com, shuffle1065.com, shuffle1066.com, shuffle1067.com, shuffle1068.com, shuffle1069.com, shuffle1070.com, shuffle71.com, shuffle888.com.
License type
What type of license does Shuffle hold?
- Checked at regulator
Curaçao license to offer games of chance under the National Ordinance on Games of Chance (Landsverordening op de kansspelen, P.B. 2024, no. 157)
Licensing authority
Who issued the license and under which law, and whether the casino’s documents agree.
Licensing authority
Who issued Shuffle’s license?
- Two answersTerms §1.1, §18.2
Terms §1.1 and §18.2 say “the Curaçao Gaming Authority”
Casino documentThe other reading: The license page and the AML policy say “the Curaçao Gaming Control Board”
The regulator’s own online gaming page says that with the LOK in force “the GCB will be referred to as the Curaçao Gaming Authority”. Both names point at the same body, but Shuffle’s documents still use both.
The certificate names the Curaçao Gaming Authority.
Source: Terms of Service and Shuffle license page
Shuffle license: one disagreement on the record
Each card sets one record against another and labels where each reading came from. Where a casino footer and a register differ, the register is the one you can check.
The document that routes a complaint names a different body from the other three.
- Casino document
Terms §1.1 and §18.2
Terms §1.1 and §18.2 say “the Curaçao Gaming Authority”
- Casino document
License page and AML policy
The license page and the AML policy say “the Curaçao Gaming Control Board”
Why they differ: The regulator’s own online gaming page says that with the LOK in force “the GCB will be referred to as the Curaçao Gaming Authority”. Both names point at the same body, but Shuffle’s documents still use both.
Shuffle license check: what we asked for and didn’t get
Regulator pages that blocked us, timed out or gave the same answer for any domain. A blocked page says nothing about the licensee.
- Our check
Curaçao searchable license register
The authority publishes its online gaming license register only as a dated PDF, with no searchable entry to link.
What this means: Shuffle’s record rests on the certificate. No register row is quoted for it, because the regulator publishes the register as a dated PDF, not a searchable record.
- Our check
iTech Labs RNG certificate for Natural Nine B.V.
The iTech Labs certificate is a PDF. We confirmed it resolves and is issued to Natural Nine B.V., but we did not machine-read its full text.
What this means: The certificate resolves and is issued to the licensee. Its contents aren’t quoted, and an RNG certificate isn’t a license anyway.
Shuffle license sources: every record behind this tab
7 documents: regulator records first, then Shuffle’s own. Registers and footers can change without notice.
- Curaçao license certificate (cert.cga.cw)https://cert.cga.cw/certificate?id=ZXlKcGRpSTZJazlqWkhKRk1ETnNlVWh1TUVGNlRVZGFjMUpLZDFFOVBTSXNJblpoYkhWbElqb2llbWQ1Y0ROUlRXeE5ZbFp1UzJWM1ZUTlJOelp2VVQwOUlpd2liV0ZqSWpvaVlqWm1NelJrWkRjeE9UWmtOakEwTURJMU9XRXlNVEJtWkdJMU1tTmtZalppWlRNeFpqSmxOMkZqTWpsbU5HSTJOVEprWXpVNVpXRXhPVE5oWWprMk55SXNJblJoWnlJNklpSjk=
- Shuffle license pagehttps://shuffle.com/info/license
- Terms of Servicehttps://shuffle.com/info/terms
- CGA online gaming license registry (PDF, Sep 8, 2026)https://gamingcontrol.spin-cdn.com/media/license_registry/20260908_20260908_ogl_license_registry.pdf
- Curaçao Gaming Authority license register pagehttps://www.cga.cw/en/133i348441001
- Curaçao Gaming Authority: online gaminghttps://www.cga.cw/regulation/online-gaming
- XCM compliance seal, linked from the footerhttps://validator-xcm.certria.com/validate?domain=shuffle.com&seal_id=41b429626b6fcba0f27d6d95839443e57b539b4bf838e24a9756e36f778876eb2d6593d429783d30da862eb0b957f21b&stamp=7e10199d5d7bcf7d90e10732cd582ec4
- 6
- 0
- 0
- 0
The six core questions: how the license was checked, the number match, the holder, the dates, the domains and the authority. “Not published” means Shuffle or its register says nothing. “Not checked by us” is our gap.
Shuffle license vs other casinos: how the record compares
Shuffle answers 6 of the 6 core questions. Across the 24 casinos with a license tab, the range is 5 to 6. Each card shows how every casino answers one question, and every name links to that casino’s license tab.
How the license was checked
All 24 answer this. A casino gets this tab only if it does.
- Published24
Shuffle 500 Casino, AceBet, BC.Game, BetFury, Chips, and 18 more
License number match
All 24 answer this. A casino gets this tab only if it does.
License holder
All 24 answer this. A casino gets this tab only if it does.
“Not checked by us” is our gap, and it never counts against a casino.
Shuffle license in the full comparison: every license record next to its footer
One table shows every casino’s license number and holder next to the regulator’s record, grouped by regulator and never ranked. It uses the same records as this tab.
Licenses at the regulator
Is the license number in the footer the one the regulator holds?
License numbers as each casino prints them, checked against the regulator’s register or certificate, and what a license doesn’t prove.
Open the full comparison →Shuffle restricted countries: 14 jurisdictions including Curaçao, then anywhere an embargo reaches
Shuffle’s Terms §8.3 name 14 jurisdictions: Australia, the British Virgin Islands, the Cayman Islands, Curaçao, Cyprus, France, Germany, the Netherlands, Portugal, Singapore, Spain, Sweden, the UK and the US. A catch-all adds anywhere the service would need a license, or that the US, the EU or the UK embargoes. The AML policy names five more sanctioned jurisdictions, none of them on that list.
- Documents checked October 4, 2026
- 4 sources cited
- 19 distinct territories named
- 6 of 8 core questions answered by Shuffle
Every list here is the casino’s own, not legal advice. We don’t say whether online gambling is allowed where you live, and a country missing from a list isn’t permission. Casinos change these lists without notice.
We haven’t tried signing up from any country.
Don’t use a VPN, a mirror site or a fake address to get around a geo-block. Casinos that publish a penalty name a breach of terms, an account closed without notice or a forfeited balance.
Shuffle restricted countries FAQ: what people ask, answered up front
Quick answers from Shuffle’s own restricted list and terms.
What does Shuffle’s catch-all clause add to the 14?
It adds “any other location … which is embargoed by the United States of America, the European Union or the United Kingdom”. None of the three embargo lists is reproduced or linked, so the real list is longer than 14 names by an unknown number.
See the row it came from →Does the Shuffle restriction follow a traveler?
Yes. Terms §8.3 covers residents and citizens of other countries while they’re in a prohibited jurisdiction, so it applies on a trip even if you live somewhere permitted.
See the row it came from →How does Shuffle check where you are?
By IP geo-blocking and a device time-zone check (AML policy), and it may refuse funding from a known U.S.-based exchange wallet. Hiding your real location with a VPN, a proxy or false details breaches the Terms (§8.4).
See the row it came from →
Shuffle restricted countries: the list, whether it’s complete, and where else it appears
- Published
Shuffle names 14 prohibited jurisdictions in Terms §8.3, and the fourth is Curaçao, the jurisdiction that licenses it.
- Published
“…and any other location from which use of the Services is not permitted under applicable laws or regulations or where provision of the Services would require licensing or registration or which is embargoed by the United States of America, the European Union or the United Kingdom”
- Published
Not the same list. Shuffle’s AML policy names 5 sanctioned jurisdictions, and none of them is in Terms §8.3.
Shuffle restricted countries list: every territory it names
19 distinct names across 2 published lists, sorted A to Z so you can find yours. A filled dot means that document names the territory.
Terms §8.3
CasinoThe casino won’t take players from these territories. 14 entries, listed in Terms of Service.
AML policy: sanctioned jurisdictions
CasinoThe casino won’t take players from these territories. 5 entries, listed in AML Policy.
Shuffle restricted countries: every territory rule, row by row
Every Shuffle restricted country rule, with its clause and source.
The restricted list
The restricted countries list, where else it appears and whether it’s complete.
Restricted countries
Which countries does Shuffle block?
- Published
Shuffle names 14 prohibited jurisdictions in Terms §8.3, and the fourth is Curaçao, the jurisdiction that licenses it.
Source: Terms of Service
Second list
Does Shuffle publish the same list anywhere else?
- Published
Not the same list. Shuffle’s AML policy names 5 sanctioned jurisdictions, and none of them is in Terms §8.3.
Shuffle does not republish the restriction list in its help center, so Terms §8.3 is the only place to read it. Terms §8.2: The Services are not offered to individuals or entities subject to United States, European Union, or other global sanctions or watchlists.
Source: AML Policy
Whether the list is complete
Is Shuffle’s restricted list complete?
- PublishedTerms §8.3
“…and any other location from which use of the Services is not permitted under applicable laws or regulations or where provision of the Services would require licensing or registration or which is embargoed by the United States of America, the European Union or the United Kingdom”
Source: Terms of Service
How far the block reaches
The license and the game providers can block countries the casino’s own list leaves out.
What the license covers
Does Shuffle’s license restrict the same countries?
- Not published
The license publishes no country map. Shuffle’s Curaçao certificate names no excluded territory, and the regulator’s online-gaming page lists none.
Checked in: Curaçao license certificate
Game provider blocks
Do game providers block countries Shuffle accepts?
- Not published
Shuffle publishes no game-provider country rules in its Terms, its policies or its help center.
Checked in: Terms of Service
What the rule covers
Whether the ban follows where you live or where you are, the VPN rules and how the casino checks your location.
Residence or location
Does Shuffle’s ban follow where you live or where you are?
- PublishedTerms §8.3
The restriction applies to residents and citizens of other jurisdictions while they are located in a prohibited jurisdiction.
Source: Terms of Service
Using a VPN
Can you use a VPN at Shuffle?
- PublishedTerms §8.4
Concealing your true location with a VPN, proxy or similar service, or giving incorrect location information, is a breach of the terms.
Source: Terms of Service
How location is checked
How does Shuffle check your location?
- Published
The AML policy says Shuffle applies IP-based geo-blocking to identified prohibited and sanctioned jurisdictions, and checks device time-zone data against restricted jurisdictions.
The AML policy says Shuffle may refuse funding from a known U.S.-based exchange wallet, “as this may indicate that the customer is a U.S. person”, and §5.4 blocks deposits from exchanges in restricted jurisdictions.
Source: AML Policy
Playing from a restricted country
What happens to your account and balance, and what you see from a blocked country.
What happens to the account
What happens to your Shuffle account if you play from a restricted country?
- PublishedTerms §3.6, §8.3, §8.4
Using Shuffle from a listed place breaches §8.3, and hiding your location breaches §8.4. §3.6 then lets Shuffle suspend or close the account, void wagers, withhold or forfeit balances and cancel winnings.
Source: Terms of Service
What a blocked player sees
What do you see at Shuffle from a blocked country?
- Published
AML Policy §5.1: customers are told at onboarding that Shuffle doesn’t serve prohibited jurisdictions and must declare they aren’t in one. Those jurisdictions are geo-blocked by IP address.
Source: AML Policy
Everywhere else
Any claim about where the casino is open, and who it says must check local law.
Where the casino says it’s open
Where does Shuffle say it’s available?
- Not published
Shuffle names no country where it is open. Its help center does carry a Canadian-dollar guide, with Interac e-Transfer deposits and withdrawals.
Checked in: Help center: Canadian dollars
Local law
Who does Shuffle make responsible for local law?
- Published
Terms §3.3(b) puts it on you: “It is your responsibility to ensure that your use of the Services is lawful.”
Source: Terms of Service
Shuffle restricted countries research notes: what we checked and what we still don’t know
Our own notes, not the casino’s statements.
Canada and Ontario
Canada is not named in Terms §8.3. Ontario runs its own iGaming registration, and we did not find Shuffle listed there.
Region-blocked games on the homepage
On Oct 4, 2026, logged out, eight game tiles on Shuffle’s homepage read “Not available in your region”. Shuffle doesn’t say which providers or regions that covers.
Shuffle restricted-country sources: every document behind this tab
4 documents, checked on October 4, 2026. Any of them can change without notice.
- Terms of Servicehttps://shuffle.com/info/terms
- AML Policyhttps://shuffle.com/info/aml
- Curaçao license certificatehttps://cert.cga.cw/certificate?id=ZXlKcGRpSTZJazlqWkhKRk1ETnNlVWh1TUVGNlRVZGFjMUpLZDFFOVBTSXNJblpoYkhWbElqb2llbWQ1Y0ROUlRXeE5ZbFp1UzJWM1ZUTlJOelp2VVQwOUlpd2liV0ZqSWpvaVlqWm1NelJrWkRjeE9UWmtOakEwTURJMU9XRXlNVEJtWkdJMU1tTmtZalppWlRNeFpqSmxOMkZqTWpsbU5HSTJOVEprWXpVNVpXRXhPVE5oWWprMk55SXNJblJoWnlJNklpSjk=
- Help center: Canadian dollarshttps://help.shuffle.com/en/articles/16879186-how-to-deposit-and-withdraw-in-canadian-dollars
- 6
- 0
- 2
- 0
The eight core questions: the list, a second list, whether it’s complete, what the license covers, game provider blocks, what happens to the account, VPN rules and location checks. “Not published” means Shuffle says nothing. “Not checked by us” is our gap.
Shuffle restricted countries vs other casinos: how its lists compare
Shuffle answers 6 of the 8 core questions. Across the 22 casinos with a countries tab, the range is 4 to 8. Each card shows how every casino answers one question, and every name links to that casino’s countries tab. Shuffle names 19 distinct territories, the 17th longest list of the 22. The lists run from 9 to 85 names. A longer list means a more detailed document, not a stricter casino.
Restricted countries
All 22 answer this. A casino gets this tab only if it does.
- Published17
Shuffle 500 Casino, Cloudbet, CoinCasino, DegenCity, Gamba, and 11 more
- Two answers5
Second list
17 of the 22 publish an answer.
Whether the list is complete
21 of the 22 publish an answer.
“Not checked by us” is our gap, and it never counts against a casino.
Shuffle complaints: escalated to the Curaçao Gaming Authority, which says it doesn’t handle them
Shuffle’s complaint route starts with live chat or support@shuffle.com. Terms §18 ties every acknowledgment and response timeline to the Complaints Handling Procedures. That document is referenced twice, linked nowhere and empty at shuffle.com/info/complaints. §18.2 sends an unresolved complaint to the Curaçao Gaming Authority, whose own page says it “does not handle individual complaints against gaming providers”. No ADR body is named. The XCM compliance seal in the footer sends you to complaints@xcm.cw once Shuffle’s own procedure is exhausted, and the self-exclusion policy gives two answers on whether an exclusion can lift.
- Documents checked October 4, 2026
- 6 sources cited
- Regulator’s own page contradicts the terms
- 4 of 6 core questions answered by Shuffle
Where the regulator describes a different route from the casino, the regulator’s route is the one you’d have to use. This is the casino’s published route, not legal advice.
Our support-chat tests are coming soon. We haven’t filed a complaint or used a self-exclusion tool at any casino. Each rule is dated and linked to its source, and casinos can change them without notice.
Shuffle complaints FAQ: what people ask, answered up front
Quick answers from Shuffle’s own documents and its regulator.
How long does Shuffle take to answer a complaint?
Shuffle doesn’t publish one. Terms §18.2 defers every acknowledgment and response timeline to the Complaints Handling Procedures, which are referenced twice, linked nowhere, missing from the help center and an empty page at shuffle.com/info/complaints.
See the row it came from →What does the Curaçao Gaming Authority do with a Shuffle complaint?
It treats it as supervisory intelligence, not a case to resolve. The CGA’s own page says it doesn’t handle individual complaints, can’t mediate or arbitrate and can’t order compensation. It also won’t disclose the status of any investigation.
See the terms vs the regulator →Does a Shuffle self-exclusion lift itself?
Yes, under section 6 of the policy. A request starts a 24-hour cooldown, then Shuffle emails you, and if you don’t extend within 24 hours of that email, the account is unrestricted. Section 5 says it can’t be re-enabled for any reason.
See the self-exclusion rules →
Shuffle complaint route: where it starts, where it goes, and who is named
- Published
Live chat or support@shuffle.com
- Published
Terms §18.2 says an unresolved complaint may be referred to the Curaçao Gaming Authority
- Not published
No ADR, mediation or arbitration body is named in any Shuffle document
Shuffle complaints to the regulator: where the terms send them, and what the regulator says
Shuffle’s terms and its regulator describe the complaint route differently, both checked on October 4, 2026. You’d have to use the regulator’s route, which Shuffle doesn’t quote.
Terms §18.2 says an unresolved complaint may be referred to the Curaçao Gaming Authority
Source: Terms of Service
The Curaçao Gaming Authority’s own online-gaming page states: “the CGA does not handle individual complaints against gaming providers. Resolving disputes between players and gaming operators is not within our mandate. As such, we do not have the authority to mediate or arbitrate in these matters. The CGA is not a civil court and cannot order gaming operators to compensate players or issue judgments.”
The same page invites complaints as supervisory intelligence (“a complaint or a pattern of complaints indicates a possible violation of the law”) and says a standardized claim form is being built. It will not disclose the status of any investigation.
Why they differ: Shuffle’s Terms still name the Authority as the place to escalate, while the Authority says resolving disputes between players and operators is not within its mandate. Both were checked on September 8, 2026.
Shuffle complaint and self-exclusion terms: every rule, row by row
Every Shuffle complaint and self-exclusion rule, with its clause and source.
Complaining to the casino
Where to complain, the deadlines on both sides, the complaints clause, the form and who settles a disputed bet.
Where a complaint starts
How do you file a complaint with Shuffle?
- PublishedTerms §18
Live chat or support@shuffle.com
Support hours: Not published in any policy document. The homepage, the Canadian-dollar guide and the VIP marketing page all say live chat runs 24/7, but no policy document commits to it.
Source: Terms of Service
Complaint deadlines
What are the Shuffle complaint deadlines?
- Cited, never published
Not published. Terms §18.2 defers entirely to the unpublished Procedures
In Terms §18, the phrase “Complaints Handling Procedures” is plain text rather than a link. The URL shuffle.com/info/complaints returned an empty page on Sep 8, 2026, and again on Oct 4, 2026, and no complaints article exists in the help center.
Source: Terms of Service
Complaints clause
Which Shuffle terms clause covers complaints?
- Published
Terms §18
Complaints Handling Procedures: Referenced twice in Terms §18 and not published anywhere we could find.
Source: Terms of Service
Complaint form
Does Shuffle have a complaint form?
- Not published
Shuffle publishes no complaint form. Terms §18.1 takes complaints by email, and the Complaints Handling Procedures it points to aren’t published.
Checked in: Terms of Service
Who decides a disputed bet
Who settles a disputed bet at Shuffle?
- Published
Terms §12.5 says a dispute about the content of a wager is determined by Shuffle by reference to its own internal records
Source: Terms of Service
Message retention
How long does Shuffle keep your support messages?
- Published
Communications about the Services are retained for six years (Terms §23.4)
Source: Terms of Service
Escalating past the casino
The escalation route, the ADR body, the regulator, and the law and courts the terms pick. Those courts are often not in the country that issued the license.
Escalation route
Where can you escalate Shuffle complaints?
- Published
Terms §18.2 says an unresolved complaint may be referred to the Curaçao Gaming Authority
Source: Terms of Service
Named ADR body
Does Shuffle name an ADR body?
- Not published
No ADR, mediation or arbitration body is named in any Shuffle document
The XCM compliance seal in Shuffle’s footer sends complaints to complaints@xcm.cw once you can show you’ve exhausted Shuffle’s own procedure. XCM is Shuffle’s compliance manager, not an ADR body.
Checked in: XCM compliance seal, linked from the footer
What the regulator says
Can you complain to Shuffle’s regulator?
- Two answers
The Curaçao Gaming Authority’s own online-gaming page states: “the CGA does not handle individual complaints against gaming providers. Resolving disputes between players and gaming operators is not within our mandate. As such, we do not have the authority to mediate or arbitrate in these matters. The CGA is not a civil court and cannot order gaming operators to compensate players or issue judgments.”
The terms: Terms §18.2 says an unresolved complaint may be referred to the Curaçao Gaming Authority
Shuffle’s Terms still name the Authority as the place to escalate, while the Authority says resolving disputes between players and operators is not within its mandate. Both were checked on September 8, 2026.
The same page invites complaints as supervisory intelligence (“a complaint or a pattern of complaints indicates a possible violation of the law”) and says a standardized claim form is being built. It will not disclose the status of any investigation.
Source: Curaçao Gaming Authority: online gaming and Terms of Service
Governing law and courts
Which law and courts govern Shuffle’s terms?
- Published
Curaçao law (Terms §20.1)
Source: Terms of Service
Class actions and jury trial
Do Shuffle’s terms waive class actions or jury trials?
- Published
Terms §20.3 requires claims to be brought individually and waives any class or representative action and, where applicable, a jury trial
Source: Terms of Service
Self-exclusion and limits
Self-exclusion, deposit limits, cool-offs, account closure and inactive accounts.
Self-exclusion
How do you self-exclude at Shuffle?
- Two answersPolicy §5
Periods: 1 day, 1 week, 1 month, 6 months or permanently. Scope: Casino only, sports only, or casino and sports combined. The policy states that during any period of self-exclusion it will not be possible to re-enable the account for any reason, and that Shuffle will take steps to detect and close new accounts.
The other document: A self-exclusion request starts a 24-hour cooldown. After it, Shuffle emails you to extend the exclusion, and “if you do not extend the self-exclusion period within 24 hours of receipt of the email, your account will be unrestricted” (Policy §6)
Section 5 describes an exclusion that cannot be lifted for any reason. Section 6 describes one that lifts itself unless you reconfirm by email within 24 hours.
Self-excluded players are removed from marketing databases. Terms §10.10 states a responsible gambling measure will not be used to prevent or delay a legitimate withdrawal, and that funds stay available during a cooling-off period.
Periods, waiting period and balance rules are in the self-exclusion table below.
Deposit, loss and wager limits
Can you set deposit limits at Shuffle?
- Two answers
Wager limits and loss limits: 1 day, 1 week or 1 month, resetting from the time the limit was set. A wager limit and a loss limit can run at the same time, and either one stops play. Loss limits are set against net losses, taking bonuses and profits into account.
The other document: The homepage says Shuffle offers “loss limits, wager limits, session time limits, and self-exclusion options”.
The limits article and the policy offer wager and loss limits only. Neither describes a session-time limit.
Limits apply instantly. A one-day cooling-off period applies before any limit can be increased, reduced or canceled. No deposit limit is offered or published anywhere. No session-time limit or reality check is offered or published.
Source: Help center: how Shuffle’s gambling limits work and shuffle.com homepage
Time-out or cool-off
Does Shuffle offer a cool-off or time-out?
- Not published
Not offered as a separate control, so the shortest option is a 1-day self-exclusion
Checked in: Help center: how Shuffle’s gambling limits work
Account closure
How do you close your Shuffle account?
- Not published
Shuffle names closing your account as an option (Terms §19.1, policy §3 and §4) but publishes no way to request it. The policy section titled “Self-excluding or closing your account” describes only self-exclusion.
Checked in: Responsible Gaming and Self-Exclusion Policy
Inactive accounts
What happens to an inactive Shuffle account?
- Published
After 24 months of inactivity, Shuffle may email the registered address. If the account stays inactive for a further 3 months, it may be closed and the balance dealt with under applicable law (Terms §11.6)
Source: Terms of Service
Dormancy fee
Does Shuffle charge a dormancy fee?
- Not published
No dormancy or administration fee is published
Checked in: Terms of Service
Gambling help links
Which gambling help groups does Shuffle link to?
- Published
BeGambleAware, Gordon Moody, Responsible Gambling Council and Gamtalk
Shuffle complaints and self-exclusion: 2 rules have two published answers each
Both readings come from Shuffle, checked the same day. Follow one document’s route and you can be refused under the other’s rule.
Self-exclusion
Periods: 1 day, 1 week, 1 month, 6 months or permanently. Scope: Casino only, sports only, or casino and sports combined. The policy states that during any period of self-exclusion it will not be possible to re-enable the account for any reason, and that Shuffle will take steps to detect and close new accounts.
Source: Responsible Gaming and Self-Exclusion Policy
A self-exclusion request starts a 24-hour cooldown. After it, Shuffle emails you to extend the exclusion, and “if you do not extend the self-exclusion period within 24 hours of receipt of the email, your account will be unrestricted”
Policy §6 · Responsible Gaming and Self-Exclusion Policy
Section 5 describes an exclusion that cannot be lifted for any reason. Section 6 describes one that lifts itself unless you reconfirm by email within 24 hours.
Deposit, loss and wager limits
Wager limits and loss limits: 1 day, 1 week or 1 month, resetting from the time the limit was set. A wager limit and a loss limit can run at the same time, and either one stops play. Loss limits are set against net losses, taking bonuses and profits into account.
Source: Help center: how Shuffle’s gambling limits work
The homepage says Shuffle offers “loss limits, wager limits, session time limits, and self-exclusion options”.
The limits article and the policy offer wager and loss limits only. Neither describes a session-time limit.
Shuffle self-exclusion: as its two documents describe it
Shuffle’s self-exclusion rules in its own words or a close paraphrase, checked on October 4, 2026.
Periods: 1 day, 1 week, 1 month, 6 months or permanently. Scope: Casino only, sports only, or casino and sports combined. The policy states that during any period of self-exclusion it will not be possible to re-enable the account for any reason, and that Shuffle will take steps to detect and close new accounts.
Section 5 describes an exclusion that cannot be lifted for any reason. Section 6 describes one that lifts itself unless you reconfirm by email within 24 hours.
Self-excluded players are removed from marketing databases. Terms §10.10 states a responsible gambling measure will not be used to prevent or delay a legitimate withdrawal, and that funds stay available during a cooling-off period.
A cell that says a rule isn’t published is about Shuffle. “Not recorded by us” is our gap. The criteria shortlist checks every casino for self-service self-exclusion with a published period, from these same documents.
Shuffle complaints research notes: what we checked and what we still don’t know
Our own notes, not the casino’s statements.
The support address rendered as an empty string
On Sep 8, 2026, and again on Oct 4, 2026, the responsible gambling page told players to contact support “at .” The email address rendered as an empty string in three places, and the license page did the same once.
A policy nearly two years older than the terms beside it
The responsible gambling policy is nearly two years older than the terms it sits beside. Policy: Responsible Gaming and Self-Exclusion Policy, Version 1.1, October 2024. Terms: Terms of Service, Version 2.0, September 2026.
Shuffle complaints sources: every document behind this tab
6 documents, checked on October 4, 2026. Any of them can change without notice.
- Terms of Servicehttps://shuffle.com/info/terms
- XCM compliance seal, linked from the footerhttps://validator-xcm.certria.com/validate?domain=shuffle.com&seal_id=41b429626b6fcba0f27d6d95839443e57b539b4bf838e24a9756e36f778876eb2d6593d429783d30da862eb0b957f21b&stamp=7e10199d5d7bcf7d90e10732cd582ec4
- Curaçao Gaming Authority: online gaminghttps://www.cga.cw/regulation/online-gaming
- Responsible Gaming and Self-Exclusion Policyhttps://shuffle.com/info/responsible-gambling
- Help center: how Shuffle’s gambling limits workhttps://help.shuffle.com/en/articles/10071185-how-shuffle-s-gambling-limits-work
- shuffle.com homepagehttps://shuffle.com/
- 4
- 1
- 1
- 0
The six core questions: where a complaint starts, the escalation route, the deadlines, the ADR body, what the regulator says and how self-exclusion works. “Not published” means Shuffle says nothing. “Not checked by us” is our gap.
Shuffle complaints compared: how its route stacks up
Shuffle answers 4 of the 6 core questions. Across the 24 casinos with a complaints tab, the range is 3 to 6. Each card shows how every casino answers one question, and every name links to that casino’s complaints tab.
Where a complaint starts
All 24 answer this. A casino gets this tab only if it does.
- Published24
Shuffle 500 Casino, AceBet, BC.Game, BetFury, Chips, and 18 more
Escalation route
15 of the 24 publish an answer.
Named ADR body
5 of the 24 publish an answer.
- Published4
- Two answers1
- Not published19
Shuffle AceBet, BC.Game, Chips, CoinCasino, DegenCity, and 13 more
Self-exclusion
24 of the 24 publish an answer.
- Published5
- Two answers19
Shuffle BC.Game, BetFury, Chips, Cloudbet, CoinCasino, and 13 more
“Not checked by us” is our gap, and it never counts against a casino.
Shuffle self-exclusion compared: every casino scored the same way
The shortlist checks every casino against the same six published terms, including self-service self-exclusion for a published period. It uses the same research as this tab.
Criteria shortlist
Which crypto casinos meet every published term we can check?
Every casino we cover, checked against the same published terms and grouped by how many it meets, A to Z in each group. A shortlist, not a ranking.
Open the criteria shortlist →Shuffle bet data: Originals took 60.54% of bets, and third-party games carried 53.12% of priced stake
We counted every figure on this tab from the bets Shuffle’s public feed showed in this window. None of it comes from Shuffle itself.
- 557,743
- 168
- Sep 16–23, 2026
- $127.2M
- 99.63%
- Payout ÷ stake in this feed
- −$467.3K
About the Shuffle feed
- Source: Public feed · USD-priced bets. Originals, game catalog and USD-priced bets.
Shuffle bet data: key findings
60.54% / 39.46%
17 Shuffle Originals draw more bets than 3,177 third-party titles
Originals took 337,676 bets. Third-party games took 220,067 bets, with a player net of −$109.69K.
Counts bets in this window. It doesn’t rank the full catalog.
22,039
Shuffle’s SHFL and BONK bets stay out of the USD totals
21,965 SHFL bets and 72 BONK bets keep their native amounts. 2 bets in otherwise priced coins came without a USD value and are held out with them.
We assume no native-to-USD rate.
10.96%
Shuffle’s USD result swings on its biggest payouts
Without the 100 biggest payouts, the payout ratio drops from 99.63% to 91.85%.
Those bets stay in the headline total. The cut is only a test.
Shuffle payout ratio: 99.63% of stake paid back
Shuffle players lost $467.3K on the bets we captured.
99.63%
Payout ÷ stake across 535,704 priced bets (96.0% of the feed). It’s a feed ratio, not a game’s RTP.
- Stake captured$127.2M
- Paid back$126.7M
Where Shuffle ranks: #3 of 15 on highest volume
- #8Best payout ratio$126,731,173.00 paid out on $127,198,448.87 staked99.63%
- #3Highest volume$127,198,448.87 staked in 168 hours$757.13K/hr
- #11Most active feeds557,743 bets in 168 hours3.32K/hr
- #12Largest player netPlayers finished $467,275.88 down−$467.28K
- #3Average bet$127,198,448.87 staked over 535,704 bets$237.44
Biggest Shuffle wins in the public feed
The top multiplier in this window was 2,292× on Alchemist Wonders.
Highest multipliers in this capture window. Amounts are as the feed priced them.
Shuffle bet sizes: half of all bets under $22.88
The largest 1% of Shuffle bets carried 41.8% of all stake.
Shuffle bet size percentiles
- 10% of bets under$1.00
- 25% under$4.94
- Half under$22.88
- 75% under$100.02
- 90% under$400.00
- 99% under$3,685.95
Bets by stake size
- < $0.100.9%0.0% of stake
- $0.10–$18.4%0.0% of stake
- $1–$1026.1%0.5% of stake
- $10–$10038.4%6.0% of stake
- $100–$1,00021.8%27.2% of stake
- $1,000–$10,0004.3%41.4% of stake
- ≥ $10,0000.3%25.0% of stake
Shuffle win rate: 50.5% of bets paid something
- Paid back at least the stake (≥ 1×)32.1%
- Doubled the stake (≥ 2×)13.7%
- ≥ 10×0.890%
- ≥ 100×0.040%
- ≥ 1,000×0.000%
The median paying bet returned 1.08× its stake.
Most played games at Shuffle: Keno leads
Keno took 18.3% of all Shuffle bets in this window.
Shuffle currencies: USDT on 29.5% of bets
- USDT29.5%45.4% of stake
- SOL23.6%13.1% of stake
- USDC18.7%23.3% of stake
- ETH9.9%10.0% of stake
- SHFL3.9%0.0% of stake
- LTC3.4%0.8% of stake
- XRP3.0%1.5% of stake
- BTC2.8%3.7% of stake
- TRX2.4%0.5% of stake
- BNB1.0%0.4% of stake
When Shuffle is busiest: Tue 23:00 UTC
Quietest hour: Fri 04:00 UTC. Busiest hours at every casino
Shuffle bet data since Jul 12, 2026: 5,419,009 bets
- Jul 12, 2026
- Sep 23, 2026
- 5,419,009
- 1,556
- 88.3%
- Keno (Shuffle)
How we captured the Shuffle bet data
Our collector reads Shuffle’s public bet feed, the live bets list on its own site. It stores every bet with the time we captured it. This tab covers the last seven days of capture, or the whole capture if it ran shorter. A public feed isn’t Shuffle’s full record, and our capture has gaps. Every figure here describes what the feed showed. How to read the data