


500 Casino Review 2026: Is it legit? Active license, a free ADR body, no limit tools
500 Casino holds an Active Curaçao license and charges no withdrawal fee of its own. It says crypto payouts are instant, and a dispute it won’t settle can go to Resolvo, a CGA-certified ADR provider, for free. It has no deposit, loss, wager or session limits. Its public feed paid out 117.64% of stake in a week, so it shows only a selected slice of play. Our real-money tests are coming soon.
- Any time, 7-day deadline
- None of its own
- Instant (stated)
- 34 territories
117.64% paid back
of the stake on 535,615 captured bets
Sep 16–23, 2026 · a feed ratio, not a game’s RTP
21 sections
500 Casino FAQ: what people ask, answered up front
Is 500 Casino legit and safe?
Yes, 500 Casino is licensed. Curaçao license OGL/2024/1354/0882 read Active for Perfect Storm B.V. on the regulator’s certificate host on Oct 4, 2026. Its Terms, footer and AML policy name three different supervisors for it.
See the certificate record →Who owns 500 Casino?
500 Casino is run by Perfect Storm B.V. (Curaçao registration number 150536) under license OGL/2024/1354/0882. The Terms also name “CSGO500” and “500PLAY” as brands of the 500 project. No directors or beneficial owners are named.
See the operator record →Is 500 Casino available in the US, the UK, Canada or Australia?
Not in the US, one of 5 names its license layer blocks outright. The UK and Australia pass that layer but lose the casino games, and the UK some mirror domains too. No layer names Canada or Ontario, and we found no iGaming Ontario registration.
See all five layers →Does 500 Casino require KYC?
Yes, whenever 500 Casino asks, even before a deposit is confirmed or a withdrawal goes out. You get 7 calendar days to answer, or the account can be suspended. It publishes no review time, trigger amount or tier table.
See the KYC rules →Does 500 Casino really pay back 118%?
No. The public All Bets feed paid out 117.64% of stake across 535,615 bets, $9.1M more than it took in 168 hours. No casino runs that loss on $51.8M of turnover, so the feed shows a selected slice.
See the captured ledger →How much of that ratio rests on a handful of bets?
Most of the excess. Without the 100 biggest player wins, 117.64% falls to 111.77%. Without 1,000 (0.187% of the capture), it falls to 102.70%.
See the tail ladder →Which 500 Casino floor should I look at?
Each one on its own, because the total describes none of them. House Originals paid out 224.70% over 202,720 bets, third-party casino games 63.64% over 320,857, and the sportsbook 141.12% over 12,038.
See the three floors →What are High Wins and Lucky Wins?
Flags 500 Casino’s own feed puts on ordinary All Bets rows, not separate tabs. They overlap on 403 bets, so counts are never added. The union of 19,443 (3.63% of the capture) holds 119.82% of its player net.
See where the flags land →How fast are 500 Casino withdrawals?
500 Casino says crypto withdrawals are instant, and our withdrawal test is coming soon. First you need Level 1, a previous deposit and one playthrough. You cash out in crypto or skins. The help center rules out fiat, while the homepage FAQ lists cards.
Open the Withdrawals tab →Does 500 Casino have a no-deposit bonus or free spins?
The welcome spins need a first eligible deposit over $25, made within 7 days. The offer is a 300% deposit bonus up to $15,000 plus 50 bonus spins in Pragmatic Play games on the first deposit. Nothing can be withdrawn before a first deposit and Level 1.
See the welcome package →What is 500 Casino’s 300% welcome bonus actually worth?
Not $15,000 of balance. The 300% comes as a rakeback boost that unlocks at $1 per $400 wagered, so the full amount takes $6,000,000 of turnover. After wagering, at most $1,000 of bonus balance converts.
See the bonus math →What is a 500 Casino VIP role worth?
500 Casino doesn’t publish the rates. It has 12 tiers from Silver to Supernova, only two with a level band, and no rakeback, reload or monthly-bonus percentage at any tier.
See the VIP ladder →What gets played on 500 Casino?
In one week, the feed showed 2,631 casino titles and 2,567 sportsbook event labels across three floors. A title is named only once it clears 100 rows and 10 accounts, so 2,217 are counted but not named.
See what gets played →How do I complain to 500 Casino if something goes wrong?
Use live chat or email support@500.casino, 24/7, then the complaint form at 500.casino/complaints. 500 Casino answers in writing within 4 weeks. If you’re not satisfied, Resolvo, a CGA-certified ADR provider, takes the case for free.
See the complaint route →Is this review sponsored?
No. No affiliate link, no paid placement and no account at 500 Casino, and it has never approached us. We found and read the 34 operator and regulator URLs behind this page ourselves.
See the source register →What would make this review complete?
Real-money tests, which are coming soon. The documents are read (34 URLs on Oct 4, 2026). 20 checks stay open across 5 chapters, covering the rates 500 Casino won’t publish and everything that needs an account.
See what is still open →
500 Casino at a glance
500 Casino runs on Curaçao license OGL/2024/1354/0882, held by Perfect Storm B.V. The certificate on the regulator’s own host reads Active. Restrictions stack in five layers. Each coin you deposit gets its own balance, a KYC request gives you 7 days to answer, and a dispute can go to Resolvo, a CGA-certified ADR provider, for free.
500 Casino’s own documents disagree in several places. The Terms, footer and AML policy name three supervisors for one license, the Bonus Terms carry two expiry clocks, and the Terms and help center tell the playthrough rule two ways. It publishes no rakeback percentage, no reload rate and no VIP threshold above Silver.
- Curaçao Gaming Authority
- OGL/2024/1354/0882
- Perfect Storm B.V · Curaçao registration number 150536
- 35 territories
- Oct 4, 2026
- 535,615
- Sep 16–23, 2026
- 168 hours
500 Casino screenshots: the logged-out lobby on desktop and mobile
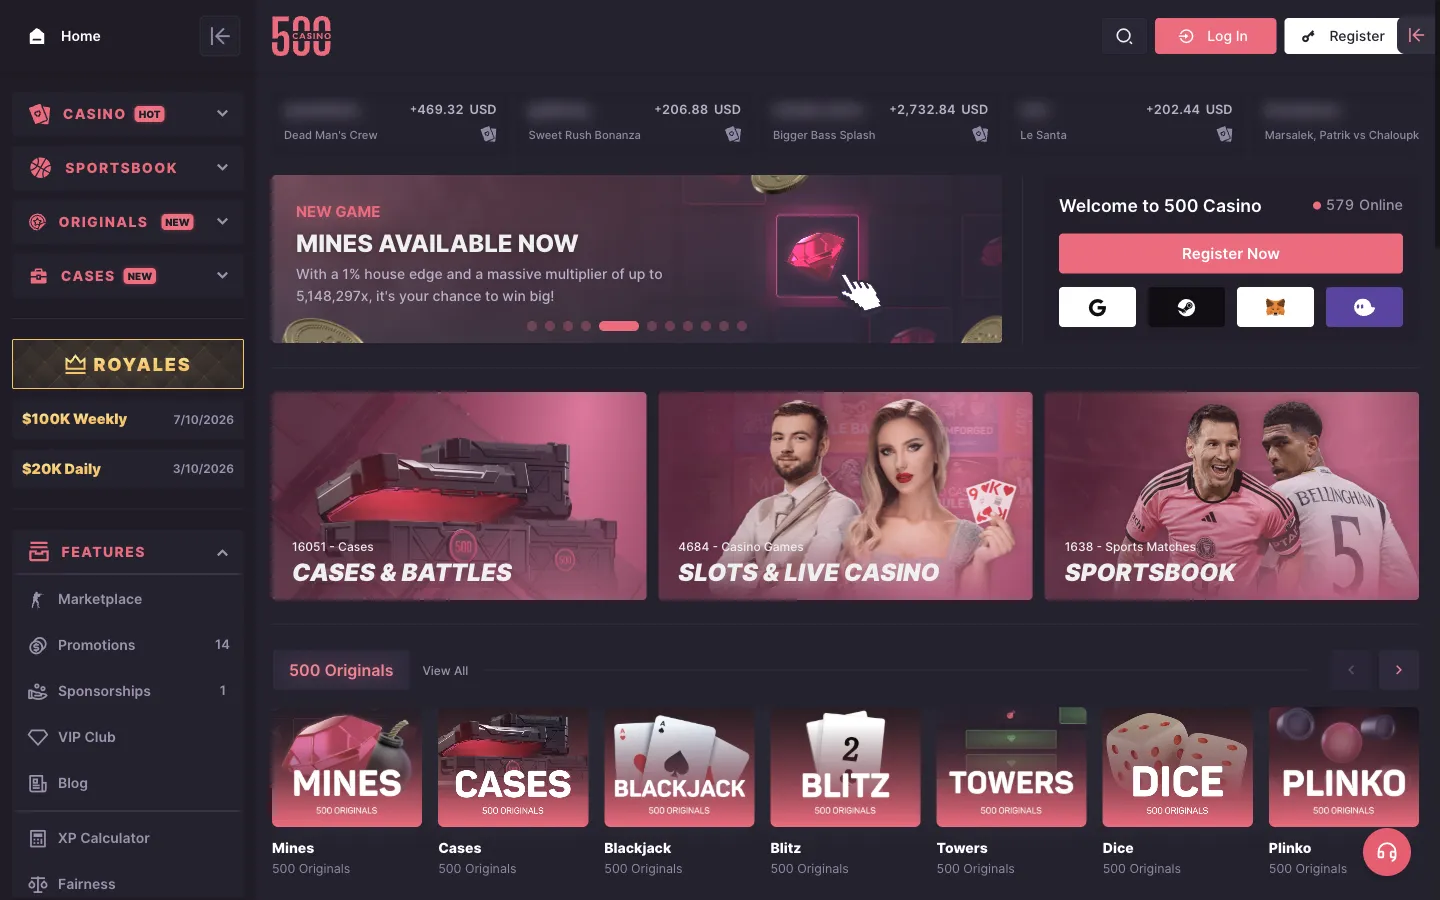
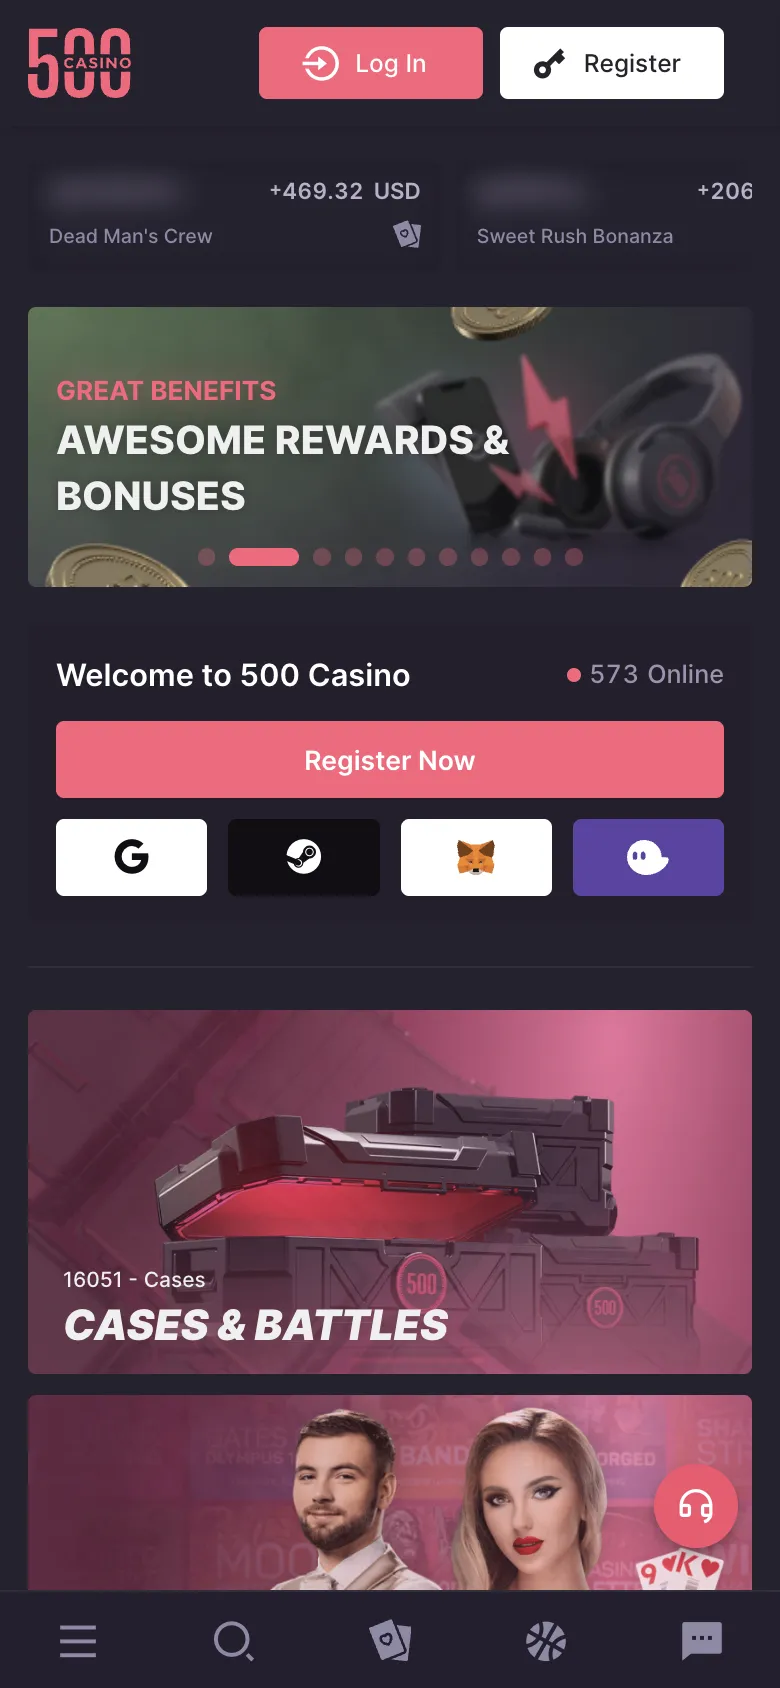
500.casino, logged out, Oct 3, 2026. Player names in the live wins strip are blurred.
500 Casino pros and cons
Pros
- License OGL/2024/1354/0882 reads Active on the regulator’s own certificate host
- Operator and paying agent named in the Terms and the footer
- No withdrawal fee of its own, so you pay only the network fee
- Crypto withdrawals stated as instant
- Self-exclusion doesn’t forfeit your balance, and you can still withdraw it
- A complaint form, a 4-week answer and a free ADR provider (Resolvo) in writing
- XP weights per game mode and anti-farming rules are published
Cons
- The Terms, footer and AML policy name three different supervisors for the license
- No deposit, loss, wager or session limits, and self-exclusion has no stated length
- No rakeback percentage, reload rate or VIP threshold above Silver
- Each coin balance pays out only in that coin (or skins), with no fiat withdrawals
- Five stacked restriction layers, with no casino games in the UK or Australia
- The Terms and the help center disagree on the playthrough rule and on fiat withdrawals
What to check before you deposit at 500 Casino
1Who runs 500 Casino, and under what license?
Perfect Storm B.V., OGL/2024/1354/0882
The certificate on the regulator’s own host reads Active. The Terms name the same authority, while the footer and the AML policy name two others.
See the evidence →Go by the certificate. The footer and the AML policy name other supervisors.
2Does 500 Casino accept players where you live?
Five stacked restriction layers
A country missing from the license-level block can still lose the sportsbook, the whole casino, or NetEnt’s games (blocked in 50 countries). Some games also carry their own country blocks, with no list.
See the evidence →Check all five layers, and your local law, before you sign up.
3What does the public feed pay back?
117.64% of stake
That is more than it took in, across 535,615 bets in a full week, so the feed shows a selected slice of play. It’s a feed ratio, not a game’s RTP.
See the evidence →Treat every ratio here as a fact about the feed, never about the games.
4Is there one number for this casino?
No, three floors disagree
House Originals paid out 224.70%, third-party casino games 63.64% and the sportsbook 141.12% in the same week. One headline number averages three things that don’t belong together.
See the evidence →Look at the floor you play on.
How we checked 500 Casino
These are the checks behind this review, each with its date. The numbers come from 500 Casino’s public bet feed and the rules from its own documents. Our method
- License checked at the regulator
500 Casino’s footer links a live certificate that matches its company, company number and license number. Its Terms, footer and AML policy name three different supervisors.
- Operator documents read
26 documents from 500 Casino’s terms, help center and policies, each one linked under Sources.
- Public bet feed captured
535,615 bets over 168 hours, Sep 16–23, 2026. Source: All Bets feed.
Coming soon
We haven’t deposited at 500 Casino yet. Each result will land here with its date and how long it took.
- Deposit
How long a crypto deposit takes to credit, on two networks.
- Withdrawal
How long a withdrawal takes to reach our wallet, and every fee on the way.
- Support chat
How fast a human replies in live chat, and whether the answer matches the terms.
- KYC check
What the casino asks for, when it asks, and how long approval takes.
500 Casino score: 8.8 out of 10
- License9.4Answered: how the license was checked, license number match, license holder, issue and expiry dates and licensed domains. Conflicting or only pointed at: licensing authority.
- Withdrawals6.8Answered: withdrawal fee, processing time, confirmations and withdrawal limit. Conflicting or only pointed at: withdrawal coins and deposit playthrough. Not published: minimum withdrawal and payout networks.
- KYC8.8Answered: what the terms require, when KYC is triggered, accepted documents, limits during a check and if you don’t verify. Not published: verification time.
- Complaints & self-exclusion10.0Answered: where a complaint starts, escalation route, complaint deadlines, named ADR body, what the regulator says and self-exclusion.
- Restricted countries9.1Answered: restricted countries, second list, whether the list is complete, what the license covers, game provider blocks, what happens to the account and how location is checked. Not published: using a VPN.
- Bonus terms8.2Answered: bonus offer, wagering requirement, game contribution, max bet while wagering, max cashout and forfeiture rules. Conflicting or only pointed at: bonus expiry. Not published: rakeback or reward rate.
- Public bet feed10.0The feed shows losing bets as well as wins, in dollars, so its totals can be checked.
Overall
8.8
Weighted from 500 Casino’s own documents, its license record and its public feed. How we score
500 Casino restricted countries: where can’t you play?
5 layers500 Casino restricts players in five stacked layers:
- A license-level block on the whole site
- A block on selected mirrors and domains
- A sportsbook block
- A casino games block
- A NetEnt block covering 50 countries
You can be in an allowed market and still lose the whole casino.
Can you play 500 Casino from the UK?
Yes, but without the casino games. The UK isn’t on the site-wide license layer, but the casino games layer names it, and so do the mirrors layer and the NetEnt list. Australia loses the casino games and NetEnt’s titles too. The five layers hold 91 entries, 67 distinct names as the Terms spell them (Terms of Service, “Region Restrictions”). Open the Terms of Service
Game-by-game blocks at 500 Casino
Some casino games carry their own country blocks, shown only as a grayed-out game in the lobby. Blocks go by “IP address and other factors”, set by 500 Casino’s license holders or by local governments. No 500 Casino document mentions VPNs.
What changed in 500 Casino’s Terms on September 24, 2026
The rewrite added ten names to the mirrors list, the UK, the US and Germany among them. The license layer now bars residents of Curaçao and the other Dutch Caribbean islands, under the local-resident rule of Curaçao’s gaming law.
No layer names Ontario, and we found no iGaming Ontario registration. This is 500 Casino’s list, not legal advice.
Does the 500 Casino feed show player countries?
No. The feed carries a timestamp, a title, a floor, a role label and the money, but no country, region, language or IP. We don’t infer location from activity hours, and the 2,567 sportsbook event labels stay unnamed.
- 5 territories
- 29 territories
- 4 territories
- 3 territories
- 50 territories
Restricted countries list
500 Casino doesn’t accept players from these 35 territories.
- United States and its territories
- Netherlands
- France
- Curaçao
- Other Dutch Caribbean islands
- Afghanistan
- Austria
- Belarus
- Belgium
- Colombia
- Congo
- Cuba
- Germany
- Iran
- Iraq
- Liberia
- Libya
- North Korea
- Norway
- Poland
- Romania
- Russia
- Slovakia
- Spain
- Sudan
- Sweden
- Syria
- Turkey
- United Kingdom
- United States
- Zimbabwe
- Israel
- Singapore
- Latvia
- Australia
Who owns 500 Casino, and is its license real?
Active at the regulatorPerfect Storm B.V., Curaçao company 150536, holds license OGL/2024/1354/0882. The certificate on the regulator’s own host read Active on Oct 4, 2026. Its Terms, footer and AML policy disagree on which authority supervises it.
500 Casino license certificate
The certificate sits on cert.gcb.cw, behind the link in 500 Casino’s own footer. It names 500.casino, Perfect Storm B.V. and company number 150536, matching 500 Casino’s documents. Open the certificate · Open the XCM compliance validator
An Active license doesn’t settle which of the names below is right. It also doesn’t fix the gaps elsewhere, like no deposit, loss, wager or session limits and a playthrough rule told two ways.
Who supervises 500 Casino?
The Curaçao Gaming Authority, by the certificate. Since September 24, 2026 the Terms say so too. The footer still uses the Gaming Control Board, the authority’s old name, and the AML policy names Antillephone. It matters, because it decides who you write to when support stops answering.
- The certificate: Curaçao Gaming Authority
- Terms (rewritten Sep 24, 2026): “licensed and regulated by the Curaçao Gaming Authority (CGA)”
- Site footer: “licensed by the Curaçao Gaming Control Board”
- AML/KYC policy (updated Dec 13, 2023): “The Company’s Supervisory Gaming Authority is Antillephone”
500 Casino RNG certificate
iTech Labs certified the Perfect Storm B.V. RNG on December 23, 2024, against the UK Remote Gambling and Software Technical Standards (February 2021). It covers nine in-house games: Wheel of Fortune, Roulette, Duels, Crash, Plinko, Towers, Dice, Cases and Mines. It covers no third-party slots or live casino, and it isn’t a license. The rewritten Terms say every casino game “use[s] a certified Random Number Generator”, and no other certificate is linked. Open the iTech Labs certificate (PDF)
- Perfect Storm B.V.
- Curaçao registration number 150536
- Korporaalweg 10, Willemstad, Curaçao
- Nine Yards Limited (Cyprus registration number HE407807)
- Xecutive Corporate Management B.V. (XCM)
- Not found
- Not found
- OGL/2024/1354/0882
- December 16, 2024
- Active on Oct 4, 2026
License
- Curaçao Gaming Authority
- OGL/2024/1354/0882
- Perfect Storm B.V · Curaçao registration number 150536
- Checked at regulator
500 Casino KYC: when can it ask for ID?
7-day deadline500 Casino can ask for ID at any time, even before a deposit is confirmed or a withdrawal goes out. You get 7 calendar days to send the documents, or the account can be suspended. 500 Casino gives itself no deadline at all.
The rewritten Terms make a check mandatory once your deposits and withdrawals reach a threshold set in the KYC Policy. That policy, last updated in December 2023, names no figure. Your data is also screened against sanctions and PEP lists, and every crypto transaction goes through blockchain analytics first.
What 500 Casino’s KYC rules leave out
500 Casino doesn’t publish the numbers you would plan around:
- Verification tiers: No tier table. The help center mentions “KYC Tiers” and never lists them.
- Money threshold: None published. The Terms point to a threshold in the KYC Policy, and the policy’s one example mentions “the posted limit” without posting it.
- Review time: None
- What works during a check: Not stated. Access can be restricted until “satisfactory compliance is achieved”.
Open the AML/KYC policy · Open the verification documents article
Have your ID and a recent proof of address ready before you withdraw. A request can land before a withdrawal goes out, and the 7-day clock runs only on your side.
- Any time, even before a deposit confirms
- 7 calendar days, or the account can be suspended
- ID card (front and back) and a proof of address under 6 months old
- A photo of you holding the card you paid with
- 18, or the age of majority under applicable law (Terms of Use)
- At least 5 years
500 Casino withdrawals: what has to happen before you cash out?
Instant (stated)Before a 500 Casino withdrawal, you need four things:
- The right balance
- Level 1
- A previous deposit
- One playthrough of the deposit
Every coin you deposit gets its own balance, and that balance pays out only in its own coin (or skins). In the feed, 15 named balance labels cover 99.85% of House Originals rows.
500 Casino coin balances
Each coin has its own balance next to a MAIN balance, so a BTC deposit plays and wins in the BTC balance. 500 Casino says it split the balances in May 2022 to stay AML-compliant. Sending balance to another player so they can cash out without wagering isn’t allowed. To leave in a different coin, the only published route runs through the skin marketplace.
- MAIN balance: Any cryptocurrency, or skins
- A specific cryptocurrency balance: That cryptocurrency only, or skins
- Any balance: Skins, to keep the P2P shop liquid
500 Casino withdrawal fees and speed
500 Casino says crypto withdrawals are instant and takes no fee of its own. You pay the network fee, and there’s no published minimum. A flagged withdrawal has no published review time.
500 Casino balance caps
Bonus balance converts to MAIN at no more than 10 times your original deposit, capped at $10,000. An account that has never deposited is capped at $600, and anything above that resets to $600 at the first deposit. Both cap the balance, not the payout.
500 Casino’s playthrough rule, told two ways
The Terms, rewritten on September 24, 2026, say you play through every deposit once before you withdraw. The help center still says it depends on how you deposit, and lists crypto in and skins out as fine without it. Neither page says which one wins.
Can you withdraw fiat from 500 Casino?
The help center says no, only crypto or skins. The homepage FAQ says you can withdraw with Visa, Mastercard, Apple Pay, Google Pay and bank transfers. Both pages were live on the same day.
500 Casino wallet rules
The rewritten Terms send crypto back to the wallet it came from. A new wallet needs extra checks on you and the wallet, third-party wallets aren’t allowed, and privacy coins like Monero are refused. The Terms also say player funds are kept apart from company money and “are protected in the event of insolvency”, with no bank, trust or audit named.
Our withdrawal test is coming soon.
Start small and test a withdrawal early, in the coin you deposited.
- Level 1, a prior deposit, 1x playthrough
- None (network fee only)
- Instant (stated)
- Crypto or skins, per the help center
500 Casino bonuses, rakeback and VIP: what is a VIP role worth?
No rate published500 Casino doesn’t publish what a VIP role is worth. It lists twelve VIP tiers, XP weights per game mode and anti-farming rules. It publishes no rakeback percentage, no tier threshold above Silver and no reload rate.
The feed stamps a role on 74.647% of bets and a level on 74.655%. So you can watch the ladder, but not what each rung pays.
500 Casino welcome bonus: 300% up to $15,000 plus 50 spins
The spins are on Pragmatic Play games. The 300% comes as a rakeback boost that unlocks at $1 for every $400 wagered. So the full $15,000 takes $6,000,000 of wagering, a total 500 Casino never prints.
500 Casino bonus expiry: 14 days or 72 hours?
The Bonus Terms give two answers. The welcome section gives you 48 hours to claim the spins and 14 calendar days for the bonus balance. Clause 5.1 says spins must be claimed or played within 30 days and bonus balance wagered within 72 hours, “unless specified differently”.
The Bonus Terms never say which one wins. If it’s clause 5.1, you get 72 hours to wager the bonus balance instead of 14 days.
500 Casino VIP levels
VIP starts at Level 500. Only two tiers have a published level, Silver (500 to 599) and Emerald (800), and the other ten have none.
There’s no rakeback percentage either. The rate depends on the game’s house edge and grows every 100 levels and with VIP tier.
- Level-up rewards: One per level, amount not published
- Royales: Daily and Weekly Royale leaderboards, entered automatically on every bet
- Tier-up bonus: One-time, claimed by replying to a welcome message from support
How 500 Casino XP works
XP comes from wagering. Wheel of Fortune, Roulette, Duels, Crash, Plinko, Towers, Cases, Case Battles and the sportsbook count 100%. Dice, Mines and Hilo count 25%. Third-party games are weighted one by one, and a higher RTP earns less XP.
500 Casino XP limits
XP counts at most 3 Wheel of Fortune bets and 2 Roulette bets per round, with no covering every color. Crash pays full XP only above a 1.5x cashout, and the sportsbook only at odds of 1.30 or better (25% at 1.01–1.09). Bonus-balance bets earn no XP, no rewards and no affiliate revenue.
Don’t budget around a rate 500 Casino hasn’t printed, and do the unlock math on the welcome boost before you count it as money.
- First deposit over $25, within 7 days
- 40x on spin winnings
- $1,000 after wagering
- $100 per spin or bet
500 Casino games and sportsbook: what gets played most?
One week of play500 Casino’s feed showed 2,631 casino titles and 2,567 sportsbook event labels in one week. They split across three floors that finished on opposite sides of break-even. That is one week of play, not a live catalog.
500 Casino floors: studios, Originals and sportsbook
59.90% of bets landed on third-party studios, 37.85% on in-house Originals and 2.25% on the sportsbook. Each bet belongs to exactly one floor, set by its provider, and a category name never overrides that. Every money figure here uses the same split.
Read the three ratios in the table separately. Only the third-party floor finished below break-even, so only it looks like an ordinary settled ledger.
The sportsbook is 2.25% of bets but 22.28% of stake, so a few very large slips carry it. The feed shows only their stake and return. That isn’t enough to claim settlement status, open slips, sportsbook profit or a full betting ledger, and we claim none of those.
Why there’s no single 500 Casino catalog number
The 2,631 casino titles and 2,567 sportsbook event labels never add up to one catalog number. Event labels are counted, never named, and the outcome buckets describe payout relation only, never settled, open or void status.
Royales is a public 500 Casino surface we don’t collect, so it’s left out of every count, total and ratio here. A title missing from these counts was either not seen in the window or held back by the privacy gate. It never means “not offered”.
- 2,631
- 12 in-house and 2,619 third-party
- 2,567
- Counted, never named
- 414
- 100 rows and 10 accounts needed per title
- 2,217
- 50,667 rows (9.46% of the capture), counted but never named
Bets and money by floor









What responsible gambling tools does 500 Casino offer?
1 control, 0 limits500 Casino offers one responsible gambling tool, self-exclusion, which can’t be undone and has no stated length. There’s no deposit, loss, wager or session limit, no reality check and no shorter time-out.
The responsible gaming page (updated Nov 7, 2025) tells you to “set yourself reasonable limits”. Neither it nor the help center gives you a tool to do it.
Can you undo 500 Casino self-exclusion?
No, not even through support. 500 Casino won’t lift it “no matter what, not even if you change your mind”. Your balance stays withdrawable while deposits, play and rewards are blocked.
House limits at 500 Casino
500 Casino can cap your bet sizes or game access “in order to mitigate potential losses and remain profitable”. Its system may also set automatic limits from your play. That’s a house control, not a player tool.
Open the responsible gaming page · Open the self-exclusion article
There’s no limit tool to lean on. Self-exclusion can’t be lifted once it’s set, so use it only when you mean it.
- From your profile settings
- No, not even by support
- Withdrawals. Deposits, play and rewards are blocked.
- Kept, and withdrawable during the exclusion
500 Casino complaints: what can you do if something goes wrong?
Resolvo ADR, freeTo complain, use live chat or email support@500.casino, 24/7. If that doesn’t settle it, file the Official Complaint Submission Form at 500.casino/complaints, free, up to 6 months after the bet or incident (Terms of Service, “Limitations of Liability and Complaints”, and the Complaints Policy, last updated Wed Sep 23 2026).
How long does 500 Casino take to answer a complaint?
500 Casino confirms receipt in writing within a week and sends a reasoned answer within 4 weeks. It can extend that once, by another 4 weeks, with notice. A responsible gambling complaint goes to a person, with 2 and 5 business days instead.
Who hears a 500 Casino dispute after support?
Resolvo, a CGA-certified ADR provider in Curaçao. You can go there after the final answer, or once a deadline passes. It costs you nothing, it rules within 90 days, and its decision binds 500 Casino but not you. The courts of Curaçao stay open either way. Open the Complaints Policy
Does the Curaçao Gaming Authority take 500 Casino complaints?
Not as disputes. The CGA says it doesn’t handle individual complaints, and 500 Casino’s policy says the same. You can still report a license breach to it. Its own pages give complaints@cga.cw, while 500 Casino’s policy gives playercomplaints@cga.cw. Open the CGA’s page
500 Casino’s validator line with no destination
The XCM compliance validator linked from 500 Casino’s footer still says “Please refer to if you can document that you have exhausted all complaint procedures of the website without satisfactory resolve.” The destination is missing, and the only link on that line points to “#”. The Terms and the Complaints Policy fill that gap with Resolvo. Open the validator and read the line
500 Casino refunds and P2P disputes
500 Casino says it is “not in any way required to grant refunds or compensation for any issue whatsoever” and that all bets are final. It won’t credit wins on rejected bets for any reason, user limits, rounding, provider errors and latency included. It also stays out of disputes between players over P2P trades.
Keep your own records from the first deposit, with transaction IDs, timestamps, screenshots and every message. In a bet dispute, 500 Casino’s own database decides, and Resolvo will ask for the same evidence.
- Resolvo, free, binds 500 Casino
- Yes, online or as a PDF
- The CGA takes breach reports, not disputes
- Coming soon
1Support
Live chat, or support@500.casino
24/7/365. Save every message, timestamp, transaction ID and a dated copy of the rule you relied on. Any escalation needs them.
2Formal complaint
The complaint form, within 6 months
Receipt confirmed within a week, a reasoned answer within 4 weeks, extendable once by 4 more. Responsible gambling complaints get 2 and 5 business days.
3Senior complaints manager
500 Casino’s final internal answer
500 Casino’s or the game provider’s records decide a bet dispute at this stage.
4Resolvo
Free ADR, outcome within 90 days
Open it after the final answer or a missed deadline. The outcome binds 500 Casino, not you, and the courts of Curaçao stay open.
What public 500 Casino bet data did we analyze?
We analyzed 535,615 bets from 168 hours of 500 Casino’s public feed, every one priced in USD. They paid out 117.64% of stake. That’s a feed ratio for this capture, not a game’s RTP, and not a claim that 500 Casino pays back more than it takes.
Why the 500 Casino feed pays out over 100%
No casino pays out more than it takes across 535,615 bets and a full week. One that did would be down $9.1M. So the public All Bets feed shows a selected slice of play, not the whole book.
500 Casino wins and losses in the feed
40.44% of published bets returned more than their stake, and 19.17% returned nothing. These four buckets compare stake and return. They aren’t settlement states, and the snapshot forbids reading them as settled, open, void or cashed out.
58.60% of bets still left the player down, which is ordinary. The sportsbook gives the selection away. 84.17% of its 12,038 published rows are net wins, and not one lost outright. That’s a display, not a settlement ledger.
How much the biggest 500 Casino wins moved the result
Drop the 100 biggest player wins (0.019% of bets) and 117.64% becomes 111.77%. Each cut removes whole bets, stake and return, ranked by player net, and recomputes the ratio from what’s left. It’s a stress test, not a corrected figure, because those bets happened. The ratio first reaches break-even once the 3,330 biggest wins are out (0.622% of the capture). The whole excess over 100% rests on that sliver.
High Wins and Lucky Wins flags
3.63% of bets carry a High Wins or Lucky Wins flag, and they hold 119.82% of the capture’s player net. Each flag matches an exact rule (0 rows disagree):
- High Wins: Source flag exactly matches player net greater than $3,000.
- Lucky Wins: Source flag exactly matches realized gross-return multiple greater than 5x.
The flags overlap on 403 bets, so their counts are never added. The union of 19,443 bets is the flagged total used everywhere here.
The 500 Casino ratio without flagged rows
Without the flagged rows, the ratio is 96.34%, and that proves nothing on its own. High Wins and Lucky Wins are defined by winning, so removing them has to lower whatever is left, selection or not. The figure only shows how much of the total rests on 3.63% of rows.
- $51,768,356
- 535,615 priced bets
- $60,899,642
- Settled returns in the same window
- $9,131,286
- Payouts beat stakes across the whole capture
- 117.64%
- Feed ratio for this capture only
How the payout ratio moves as the biggest player wins come out
The ladder loses 5.87 points to a hundred bets and 14.94 points to a thousand. There’s no single-bet cut, because subtracting one bet would reveal its exact stake and return, which our privacy rules forbid. The ladder shows how few rows carry the headline. It isn’t a corrected payout figure.
- 535,615
- 168
- 117.64% paid back
- Sep 16–23, 2026
500 Casino compared with similar casinos
All casinosSee how 500 Casino stacks up against similar casinos on score, license, restricted countries and bet data.
| Casino | Score | License | Restricted | Bets captured | Feed payout ratio |
|---|---|---|---|---|---|
| 500 Casino | 8.8 / 10 | Curaçao · checked | 35 territories | 535,615 | 117.64% |
 Cloudbet Cloudbet | 8.7 / 10 | Curaçao · checked | 22 territories | 2,405,866 | 73.64% |
 Chips Chips | 8.6 / 10 | Anjouan · checked | 27 territories | 916,202 | 147.12% |
 Gamdom Gamdom | 8.5 / 10 | Anjouan · checked | 37 territories | 9,894,905 | 104.05% |
 Roobet Roobet | 8.5 / 10 | Curaçao · checked | 25 territories | 586,444 | 96.85% |
Our score
Is 500 Casino legit? Yes, with an Active license, a named dispute body and no limit tools
Check all five restriction layers, start small, and cash out in the coin you deposited.
- Data behind this review: 535,615 bet records. 2,631 casino titles in 168 hours, every row priced in USD.
- What the feed pays back: 117.64%. 102.70% without its 1,000 biggest player wins, a 14.94-point swing.
- Main concern: No limit tools. No deposit, loss, wager or session limit. Self-exclusion is the only control, and its length isn’t published.
- A selected feed: 40.44% of bets were net wins, 84.17% on the sportsbook. A settled ledger would show far fewer winners.
What could change this verdict
Availability and licensing are settled (Oct 4, 2026). What’s left is the rates 500 Casino doesn’t publish and the tests that need an account.
- What happens once 500 Casino asks for ID? (4 open checks)
- Does the 500 Casino cashier work as written? (4 open checks)
- What is a VIP role worth in money? (4 open checks)
- Does 500 Casino self-exclusion stop play? (4 open checks)
- Does the 500 Casino complaint route work as written? (4 open checks)
In the public feed, a hundred accounts placed 52.98% of the $51.8M staked. 3.63% of bets carry the feed’s own win flags.
Still to test: a deposit, a withdrawal, KYC, self-exclusion and a complaint. Our real-money tests are coming soon.
Who is 500 Casino best for, and who should skip it?
- Crypto players who hate withdrawal fees. 500 Casino charges none of its own (you pay the network fee) and says crypto payouts are instant.
- Originals fans. 500 Casino’s in-house games took 37.85% of bets in the feed. iTech Labs certified the RNG behind nine of them, including Crash, Plinko, Mines and Cases.
- Skin traders. Any balance can cash out as CS2 or Rust skins through a connected Steam account, and Cases and Case Battles count 100% toward XP.
- Players who want a dispute route past support. Resolvo, a CGA-certified ADR provider, hears 500 Casino disputes for free, and its decision binds the casino.
- You’re in the UK or Australia. 500 Casino blocks its casino games in both, and NetEnt’s games in 50 countries.
- You’re here for the 300% welcome bonus. Unlocking the full $15,000 takes $6,000,000 of wagering, and the Bonus Terms carry two expiry clocks without saying which one wins.
- You want to cash out in another coin, or in fiat. Every coin you deposit gets its own balance, which pays out only in that coin or in skins. The help center rules out fiat withdrawals, even though the homepage FAQ lists them.
- You want deposit limits. There are none, and no loss, wager or session limit either. Self-exclusion is the only control, and it can’t be undone.
Sources for this 500 Casino review
Operator documents (26)
- Curaçao license certificate (cert.gcb.cw) · License
- Terms of Service · License
- Site footer · License
- XCM compliance validator · License
- AML / KYC Policy · License
- Terms of Service, NetEnt tab · Restricted countries
- Help center: verification documents · KYC
- Help center: account restrictions · KYC
- Help center · KYC
- Help center: withdrawal fees · Withdrawals
- Help center: withdrawal requirements · Withdrawals
- Help center: withdrawal time · Withdrawals
- Help center: deposit time · Withdrawals
- Help center: real-money withdrawal · Withdrawals
- Help center: wager before withdrawing · Withdrawals
- Help center: balance types · Withdrawals
- Bonus Terms · Bonuses
- Help center: rewards · Bonuses
- Help center: becoming VIP · Bonuses
- Complaints Policy · Complaints
- Curaçao Gaming Authority: online gaming · Complaints
- Help center: self-exclusion · Complaints
- Official Complaint Submission Form (PDF) · Complaints
- Responsible gaming page · Complaints
- Help center: can I delete my account · Complaints
- Privacy Policy · Complaints
About this 500 Casino review
Founder and author, 0xCasinos
Alex Savelle runs 0xCasinos and writes everything on it. Since July 12, 2026, Alex has captured 210 million bets from the public feeds of 24 crypto casinos. Alex turns that data into the reviews, rankings and studies on this site.
When a review covers a casino’s rules, Alex reads its terms, help center and license record first. Every document behind a claim is linked, and a review built from the bet feed alone says so. The numbers come from the captured feeds. The casino rules come from the casino’s own documents, dated the day they were read.
- Documents read again. 500 Casino rewrote its Terms on September 24, 2026 and published a Complaints Policy and a new Privacy Policy on September 23. It now names Resolvo as its ADR provider and has a complaint form. The Terms name the Curaçao Gaming Authority, the mirrors list grew by ten names, and the playthrough rule now covers every deposit, against the help center. The certificate still read Active.
- Data refreshed. The capture now covers Sep 16 to Sep 23, 2026: 168 hours and 535,615 public 500 Casino All Bets events across 2,631 casino titles and 2,567 sportsbook event labels (names withheld), run through the same gates.
- Operator documents read. The Curaçao certificate for OGL/2024/1354/0882 was pulled from its own host and read Active. The Terms, Bonus Terms, AML/KYC policy, responsible gaming page, VIP page and fourteen help center articles were read in full. Availability and licensing closed completely. Three conflicts inside 500 Casino’s own documents were printed side by side. They covered the supervisor, the bonus expiry and an escalation sentence with no destination. Nothing was tested with real money.
- First published, bet data only. A 168-hour capture of public 500 Casino All Bets events, analyzed across three separate floors, by casino title and by sportsbook event label (names withheld), with the generator’s scope, money, time, semantic and privacy gates enforced. The operator half (license, company, markets, KYC, cashier, rewards, responsible play and complaints) was not yet researched, and each of those chapters said so.
500 Casino bonus: 300% up to $15,000, paid as rakeback at $1 per $400 wagered
The 300% match goes up to $15,000 on a first deposit over $25, and none of it lands as balance. It comes as a rakeback boost that unlocks at $1 for every $400 you wager. The 50 bonus spins carry a 40x WR on winnings, bets with bonus balance are capped at $100, and at most $1,000 of bonus balance converts.
- October 4, 2026
- 5
- 7 of 8
Published rules only
We haven’t claimed a bonus at any casino. Every rule below is the casino’s own, linked to its source.
500 Casino bonuses FAQ: what people ask, answered up front
Quick answers from 500 Casino’s own bonus terms.
Which games count toward the 500 Casino bonus WR?
Wagering contribution follows RTP. A game at 95% RTP or lower reduces the requirement 1:1, and one at 99.5% only at 1:10. Casino welcome bonus balance can’t be played on the sportsbook or esports.
See the row it came from →How much do you have to wager to unlock the full $15,000?
At least $6,000,000. 500 Casino publishes the ratio, $1 of boost per $400 wagered, but not the total. Low-edge games count for less, so $6,000,000 is the floor.
See the row it came from →How long does a 500 Casino bonus last?
The same Bonus Terms give two answers. The welcome-package section gives you 48 hours to claim bonus spins and 14 calendar days for bonus balance. Clause 5.1 allows 30 days to claim spins and 72 hours to wager bonus balance.
See both readings →
500 Casino bonus offer, wagering and expiry: the key rules
- Published
300% deposit bonus up to $15,000 plus 50 bonus spins in Pragmatic Play games on the first deposit
- Published
The 300% is not credited as balance. It is added as a rakeback boost that unlocks at $1 of boost for every $400 wagered
- Two answers
Bonus spins must be claimed within the first 48 hours, and bonus balance is available for 14 calendar days
500 Casino bonus terms: every rule, row by row
Every 500 Casino bonus rule, with its clause and source.
The offer
The headline offer, the minimum deposit and the rakeback rate.
Bonus offer
What bonus does 500 Casino offer?
- Published
300% deposit bonus up to $15,000 plus 50 bonus spins in Pragmatic Play games on the first deposit
300% deposit bonus up to $15,000 on the same rakeback-boost mechanic, plus a freebet matching the deposit up to $500
Source: Bonus Terms
Minimum deposit
What is the minimum deposit for a 500 Casino bonus?
- Published
First eligible deposit over $25, made within 7 days
Promotional campaigns that attach a bonus to a next deposit carry a 100% wager requirement on the initial deposit
Source: Bonus Terms
Rakeback or reward rate
What rakeback rate does 500 Casino pay?
- Not published
No rakeback percentage is published. 500 Casino states only that the rate depends on the house edge of the game and grows every 100 levels and with VIP tier.
Checked in: Help center: rewards
Wagering requirements
The WR, game contribution and the max bet while you wager.
Wagering requirement
What is the 500 Casino bonus wagering requirement?
- Published
The 300% is not credited as balance. It is added as a rakeback boost that unlocks at $1 of boost for every $400 wagered
Unlocking the full $15,000 boost at $1 per $400 wagered requires $6,000,000 of wagering. 500 Casino publishes the ratio and does not publish that total. Separately, the Terms set a 40x wagering requirement on winnings from bonus spins and a 1x wagering requirement on winnings from the sportsbook freebet.
Source: Bonus Terms
Game contribution
Which games count toward the 500 Casino WR?
- Published
Wagering contribution is tied to RTP. A game at 95% RTP or lower reduces the requirement 1:1, while a game at 99.5% RTP reduces it at a 1:10 ratio
Source: Bonus Terms
Max bet while wagering
What is the max bet on a 500 Casino bonus?
- Published
Maximum total bet with bonus balance is $100 per spin or per bet
Source: Bonus Terms
What you can keep
The max cashout, the expiry and what voids the bonus.
Max cashout
Is there a max cashout on 500 Casino bonuses?
- Published
The maximum bonus balance convertible after wagering is $1,000
Source: Bonus Terms
Bonus expiry
When does a 500 Casino bonus expire?
- Two answers
Bonus spins must be claimed within the first 48 hours, and bonus balance is available for 14 calendar days
Both readings sit in the same Bonus Terms document. The general clause opens with “unless specified differently”, which may mean it yields to the welcome section, but the document never says so. If the general clause wins, you get 72 hours to wager the bonus balance instead of 14 days.
500 Casino reserves the right to cancel any prize, Royale, VIP or third-party reward left unclaimed for more than 6 months
Source: Bonus Terms
Forfeiture rules
What voids a 500 Casino bonus?
- Published
Withdrawing real-money balance before the wagering requirement of an attached bonus is met forfeits the bonus and every win from it
Source: Bonus Terms
VIP program
VIP tiers, reward timing and what’s blocked while a WR is live.
VIP tiers
What are the 500 Casino VIP tiers?
- Published
VIP status begins at Level 500, across twelve named tiers: Silver, Gold, Sapphire, Emerald, Ruby, Diamond, Pearl, Obsidian, Opal, Stardust, Nebula, Supernova.
Only two level bands are published: Silver is Level 500 to 599, and Emerald is named as Level 800. The remaining ten tiers carry no published level requirement.
Source: Help center: becoming VIP
When rewards land
How often does 500 Casino pay rewards?
- Published
Generated on all eligible bets from registration, including at Level 0, claimable any number of times a day
Weekly reloads: Every Friday, based on recent activity. The percentages rise with VIP tier. Monthly bonus: Around the middle of the calendar month, based on monthly activity, with a percentage of losses added as lossback. Daily cases: One free daily case if monthly activity crosses an unpublished threshold. The lowest case value is $0.50.
Source: Help center: rewards
Blocked while wagering
What can’t you do while a 500 Casino bonus is active?
- Published
Casino welcome bonus balance may not be played on sportsbook or esports, and sportsbook welcome bonus balance may not be played on casino games
Bets made with bonus balance generate no affiliate revenue, no XP and no rewards of any kind
Source: Bonus Terms
Eligibility and deposit rules
Who is eligible, and the deposit rule that applies even with no bonus.
Bonus abuse and eligibility
When can 500 Casino take a bonus back?
- Published
One welcome package per person, defined as one per household address, IP, email, telephone number and payment method. 500 Casino also reserves the right to refuse the package on internal metrics
Players who are self-excluded cannot claim rewards, enter offers or claim prizes
Source: Bonus Terms
Deposit playthrough
Do you have to wager a 500 Casino deposit with no bonus?
- Two answers
Players must play through the full value of each deposit at least once before withdrawing. The Terms call it an anti-money-laundering rule that applies to all deposits and comes on top of any bonus WR (Terms, “Deposits and Withdrawals”).
Since Sep 24, 2026, the Terms say the play-through applies to all deposits. The help center still makes it depend on how you deposit, and lists crypto in and skins out as allowed. Both are 500 Casino documents, and neither says which one wins.
Source: Terms of Service and Help center: wager before withdrawing
This deposit rule also applies to cashouts. See 500 Casino withdrawal rules
500 Casino bonus terms in conflict: 2 rules have two published answers each
Both readings come from 500 Casino. You only find out which one applies after you deposit.
Bonus expiry
Bonus spins must be claimed within the first 48 hours, and bonus balance is available for 14 calendar days
Both readings sit in the same Bonus Terms document. The general clause opens with “unless specified differently”, which may mean it yields to the welcome section, but the document never says so. If the general clause wins, you get 72 hours to wager the bonus balance instead of 14 days.
Deposit playthrough
Players must play through the full value of each deposit at least once before withdrawing. The Terms call it an anti-money-laundering rule that applies to all deposits and comes on top of any bonus WR (Terms, “Deposits and Withdrawals”).
Since Sep 24, 2026, the Terms say the play-through applies to all deposits. The help center still makes it depend on how you deposit, and lists crypto in and skins out as allowed. Both are 500 Casino documents, and neither says which one wins.
500 Casino bonus sources: every document behind this tab
5 documents, checked on October 4, 2026. Any of them can change without notice.
- Bonus Termshttps://500.casino/en/terms-of-service/bonus-terms
- Help center: rewardshttps://help.500.casino/en/articles/5925550-what-kind-of-rewards-does-500-casino-offer
- Help center: becoming VIPhttps://help.500.casino/en/articles/5925123-can-i-become-vip
- Terms of Servicehttps://500.casino/en/terms-of-service
- Help center: wager before withdrawinghttps://help.500.casino/en/articles/5925219-do-i-need-to-wager-my-deposits-before-i-can-withdraw-is-trading-permitted
- 7
- 0
- 1
- 0
The eight core questions: offer, WR, expiry, rakeback rate, game contribution, max bet, max cashout and forfeiture. “Named, never stated” means 500 Casino says the rule exists but prints no figure on a public page. “Not published” means 500 Casino says nothing. “Not checked by us” is our gap.
500 Casino bonuses compared: how its terms stack up
500 Casino answers 7 of the 8 core questions. Across the 13 casinos with a bonuses tab, the range is 6 to 8. Each card shows how every casino answers one question, and every name links to that casino’s bonuses tab.
Bonus offer
13 of the 13 publish an answer.
Wagering requirement
All 13 answer this. A casino gets this tab only if it does.
Bonus expiry
12 of the 13 publish an answer.
“Not checked by us” is our gap, and it never counts against a casino.
500 Casino withdrawal time: instant, it says, with no house fee and one coin per balance
500 Casino says every crypto withdrawal is instant and takes nothing beyond the blockchain fee. A small share is flagged for review, with no published review time. Balances are kept per coin, so a BTC deposit leaves only as BTC or as skins. Its homepage FAQ lists card and bank withdrawals that the help center says don’t exist.
- October 4, 2026
- 9
- 6 of 8
Real-money withdrawal tests: coming soon
Our real-money withdrawal tests are coming soon. Every figure below is the casino’s own published rule, linked to its source.
500 Casino withdrawals FAQ: what people ask, answered up front
Quick answers from 500 Casino’s own cashier rules.
What does it cost to withdraw from 500 Casino?
Only the blockchain fee. 500 Casino charges nothing of its own. The network fee comes out of the amount you receive, varies by coin and over time, and some coins carry none.
See the row it came from →Why can I only withdraw one cryptocurrency at 500 Casino?
Each depositable coin has its own balance next to a MAIN balance, and play stays in the balance that funded it. A coin balance leaves as that coin or as skins, while the MAIN balance leaves as any coin or as skins.
See the row it came from →Can I withdraw a 500 Casino deposit I haven’t played?
Not under the Terms. Since September 24, 2026, they make you play through every deposit once before you withdraw. The help center still says it depends on how you deposit. A withdrawal also needs at least Level 1 and a previous deposit.
See the row it came from →
500 Casino withdrawal fee, time and wagering: the key rules
- Published
The blockchain transaction fee is paid by the player and deducted from the amount received. It differs per coin and changes over time, and some coins carry no fee.
- Published
All cryptocurrency withdrawals are stated to be instant. A “Queued” state means the transaction has been sent and is awaiting network confirmation.
- Two answers
Players must play through the full value of each deposit at least once before withdrawing. The Terms call it an anti-money-laundering rule that applies to all deposits and comes on top of any bonus WR (Terms, “Deposits and Withdrawals”).
500 Casino withdrawal terms: every rule, row by row
Every 500 Casino withdrawal rule, with its clause and source.
Withdrawal fees
The casino fee, the network fee and any charge for withdrawing too often.
Withdrawal fee
Does 500 Casino charge a withdrawal fee?
- Published
The blockchain transaction fee is paid by the player and deducted from the amount received. It differs per coin and changes over time, and some coins carry no fee.
The current fee is shown on the withdrawal page of each cryptocurrency and is not published as a table
Source: Help center: withdrawal fees
Network fee
Who pays the network fee at 500 Casino?
- Published
You pay it. The help center says the network fee comes out of the amount you receive, and that a coin with no fee pays out the exact amount you withdraw.
Source: Help center: withdrawal fees
How often you can withdraw
How many withdrawals a day does 500 Casino allow?
- Not published
No 500 Casino document limits how many withdrawals you can make. The only daily limit in the help center is on card deposits.
Checked in: Help center: withdrawal requirements
Withdrawal time
The processing time the casino states and the confirmations it waits for.
Processing time
How long do 500 Casino withdrawals take?
- Published
All cryptocurrency withdrawals are stated to be instant. A “Queued” state means the transaction has been sent and is awaiting network confirmation.
A low percentage of withdrawals are flagged for review and may take longer, and no review time is published. The homepage FAQ promises “low fees and near-instant transactions” for crypto.
Source: Help center: withdrawal time
Deposit confirmations
How many network confirmations does 500 Casino need?
- Published
Deposits credit once the minimum required confirmations are reached, and the number is shown per coin on the deposit page. BTC is named as crediting at 1 confirmation.
Source: Help center: deposit time
Withdrawal limits
The minimum, the maximum and what happens to a win too big to pay at once.
Minimum withdrawal
What is the minimum withdrawal at 500 Casino?
- Not published
No withdrawal minimum is published
Checked in: Help center: withdrawal requirements
Withdrawal limit
Is there a withdrawal limit or max payout at 500 Casino?
- Published
No per-withdrawal cap is published. The Terms cap two balances instead: an account that has never deposited at $600, and bonus money converted to MAIN at 10 times the deposit, $10,000 at most.
A bonus’s own terms can set a different conversion limit.
Source: Terms of Service
Big wins paid in installments
Does 500 Casino pay big wins in installments?
- Published
For large withdrawal amounts 500 Casino reserves the right to pay in periodic installments over time, decided case by case. No threshold is published.
Source: Terms of Service
Coins and networks
The coins and networks the casino pays out on.
Withdrawal coins
Which coins can you withdraw from 500 Casino?
- Two answers
500 Casino does not offer direct real-money withdrawals. Withdrawals are cryptocurrency, or P2P items for CS2 and Rust through a connected Steam account.
The help center says there are no real-money withdrawals. The homepage FAQ lists five card and bank routes you can withdraw with. Both pages are live, and neither says which one is right.
Cryptocurrency: ≈$0.60, varying by coin, with the exact figure on each deposit sub-page · Real money: ≈$3, depending on payment method · Skins: ≈$0.30 minimum item value
Source: Help center: real-money withdrawal and Homepage FAQ
Payout networks
Which networks does 500 Casino pay out on?
- Not published
No list of payout networks is published. The help center names the coins (BTC, ETH, LTC, XRP and USDT among them) but no network for any of them. The per-coin pages sit in the cashier, behind an account.
Checked in: Help center: real-money withdrawal
Before you cash out
What stands between your balance and a payout: wagering, KYC and where the money can go.
Deposit playthrough
Do you have to wager your deposit before withdrawing from 500 Casino?
- Two answers
Players must play through the full value of each deposit at least once before withdrawing. The Terms call it an anti-money-laundering rule that applies to all deposits and comes on top of any bonus WR (Terms, “Deposits and Withdrawals”).
Since Sep 24, 2026, the Terms say the play-through applies to all deposits. The help center still makes it depend on how you deposit, and lists crypto in and skins out as allowed. Both are 500 Casino documents, and neither says which one wins.
Source: Terms of Service and Help center: wager before withdrawing
KYC and holds
What can delay 500 Casino withdrawals?
- Published
A player must be at least Level 1 and have made a previous deposit before any withdrawal
A large or abnormal win can be investigated by the game provider, taking from a few hours to a few days. Withdrawals are blocked during that period and the Terms put the duty of not touching the balance on the player.
Withdrawal destination
Can you withdraw to a different wallet at 500 Casino?
- Two answers
The Terms say withdrawals are restricted to the deposit method you used, and crypto goes back to the wallet address the matching deposit came from. A new or different wallet needs enhanced verification of you and the wallet, and third-party wallets are not allowed (Terms, “Cryptocurrency Terms”).
The help center still lets the MAIN balance pay out in any coin and any balance pay out as skins, whatever the deposit was. The Terms tie each withdrawal to the method you deposited with. Neither document mentions the other.
Privacy coins are refused: Monero, Zcash in shielded mode and Dash via PrivateSend (Terms, “Cryptocurrency Terms”).
Source: Terms of Service and Help center: balance types
500 Casino withdrawal terms in conflict: 3 rules have two published answers each
Both readings come from 500 Casino. You only find out which one applies at the cashier.
Withdrawal coins
500 Casino does not offer direct real-money withdrawals. Withdrawals are cryptocurrency, or P2P items for CS2 and Rust through a connected Steam account.
The help center says there are no real-money withdrawals. The homepage FAQ lists five card and bank routes you can withdraw with. Both pages are live, and neither says which one is right.
Deposit playthrough
Players must play through the full value of each deposit at least once before withdrawing. The Terms call it an anti-money-laundering rule that applies to all deposits and comes on top of any bonus WR (Terms, “Deposits and Withdrawals”).
Since Sep 24, 2026, the Terms say the play-through applies to all deposits. The help center still makes it depend on how you deposit, and lists crypto in and skins out as allowed. Both are 500 Casino documents, and neither says which one wins.
Withdrawal destination
The Terms say withdrawals are restricted to the deposit method you used, and crypto goes back to the wallet address the matching deposit came from. A new or different wallet needs enhanced verification of you and the wallet, and third-party wallets are not allowed (Terms, “Cryptocurrency Terms”).
The help center still lets the MAIN balance pay out in any coin and any balance pay out as skins, whatever the deposit was. The Terms tie each withdrawal to the method you deposited with. Neither document mentions the other.
500 Casino withdrawal sources: every document behind this tab
9 documents, checked on October 4, 2026. Any of them can change without notice.
- Help center: withdrawal feeshttps://help.500.casino/en/articles/5971747-do-i-have-to-pay-an-additional-fee-when-withdrawing-cryptocurrency
- Help center: withdrawal requirementshttps://help.500.casino/en/articles/5925240-what-are-the-requirements-for-withdraw
- Help center: withdrawal timehttps://help.500.casino/en/articles/5925226-how-long-does-it-take-for-my-cryptocurrency-withdraw-to-get-sent
- Help center: deposit timehttps://help.500.casino/en/articles/5925223-how-long-does-a-cryptocurrency-deposit-take
- Terms of Servicehttps://500.casino/en/terms-of-service
- Help center: real-money withdrawalhttps://help.500.casino/en/articles/5925218-can-i-withdraw-my-balance-in-real-money
- Homepage FAQhttps://500.casino/
- Help center: wager before withdrawinghttps://help.500.casino/en/articles/5925219-do-i-need-to-wager-my-deposits-before-i-can-withdraw-is-trading-permitted
- Help center: balance typeshttps://help.500.casino/en/articles/6208745-how-do-the-separate-balance-types-work
- 6
- 0
- 2
- 0
The eight core questions: fee, processing time, deposit playthrough, minimum, maximum, coins, networks and confirmations. “Named, never stated” means 500 Casino says the rule exists but prints no figure on a public page. “Not published” means 500 Casino says nothing. “Not checked by us” is our gap.
500 Casino withdrawals compared: how its cashier rules stack up
500 Casino answers 6 of the 8 core questions. Across the 23 casinos with a withdrawals tab, the range is 3 to 8. Each card shows how every casino answers one question, and every name links to that casino’s withdrawals tab.
Withdrawal fee
15 of the 23 publish an answer.
Processing time
20 of the 23 publish an answer.
Deposit playthrough
21 of the 23 publish an answer.
Minimum withdrawal
10 of the 23 publish an answer.
“Not checked by us” is our gap, and it never counts against a casino.
500 Casino KYC: any time, and seven calendar days to send your documents
500 Casino can ask for KYC at any time. Its Terms make a check mandatory once your deposits and withdrawals reach a threshold “set out in the KYC Policy”, and that policy names no figure. A check means an ID card, front and back, and proof of address under six months old. Its AML policy runs three tiers of due diligence and screens players through SumSub, Chainalysis, AMLBot and SEON.
- October 4, 2026
- 6
- No KYC claim published
- 5 of 6 core questions
Where a casino’s marketing and its terms disagree, the terms bind you. Every rule here is the casino’s own, not legal or financial advice.
Our ID-check tests are coming soon. Each rule is dated and linked to its source, and casinos can change them without notice.
500 Casino KYC FAQ: what people ask, answered up front
Quick answers from 500 Casino’s own KYC rules.
What is the “posted limit” in 500 Casino’s KYC rules?
A crypto withdrawal threshold 500 Casino never publishes. Its AML policy’s one example puts a customer who wants to withdraw more than “the posted limit” through KYC to raise it. The rewritten Terms point to a threshold in that policy, which names none.
See the row it came from →What does 500 Casino accept as proof of identity and address?
A photo of your ID card, front and back, plus proof of address under six months old, such as a bank statement, utility bill or government correspondence. If a payment is flagged, it can also ask for a photo of you holding the card you paid with.
See the row it came from →How long does a 500 Casino verification take?
500 Casino publishes no review time. The only deadline is yours, seven calendar days to send requested documents, or the account can be suspended completely.
See the row it came from →
500 Casino KYC: what it claims, what it requires and when it asks
The homepage and its FAQ say nothing about verification, either way. The FAQ’s nine questions cover the casino, its games, bonuses, countries, payments, XP, sports and cases, and none mentions KYC.
500 Casino can ask for any KYC documents it deems necessary to check your identity, age and location. It can also ask for them to validate payment methods and source of funds
Additional AML/KYC procedures can be requested at any time, including before deposits are confirmed or before withdrawals are sent
- On deposit
- Before a withdrawal
- Any time, at the casino’s discretion
500 Casino KYC requirements: every rule, row by row
Every 500 Casino KYC rule, with its clause and source.
Claim vs terms
What the casino says about KYC, what its terms require and when a check is triggered.
What the casino claims
What does 500 Casino say about KYC before you sign up?
- Not published
The homepage and its FAQ say nothing about verification, either way. The FAQ’s nine questions cover the casino, its games, bonuses, countries, payments, XP, sports and cases, and none mentions KYC.
Checked in: Homepage and FAQ
What the terms require
What KYC does 500 Casino require before it pays out?
- PublishedTerms of Service, “KYC/AML Policy”
500 Casino can ask for any KYC documents it deems necessary to check your identity, age and location. It can also ask for them to validate payment methods and source of funds
Three tiers in the AML policy: Simplified for low-risk activity, Customer Due Diligence as the standard, Enhanced for high-risk customers, large transactions or flagged crypto
Source: Terms of Service
When KYC is triggered
When does 500 Casino ask for KYC?
- Published
Additional AML/KYC procedures can be requested at any time, including before deposits are confirmed or before withdrawals are sent
- On deposit
- Before a withdrawal
- Any time, at the casino’s discretion
The Terms make identity verification mandatory once your cumulative deposits and withdrawals reach “the verification threshold set out in the KYC Policy”. The KYC Policy, last updated Dec 13, 2023, publishes no such figure. The AML policy gives one worked example: a customer wanting to withdraw more than “the posted limit” in cryptocurrency is put through standard due diligence and KYC to raise their threshold. The posted limit itself is not published.
Source: AML / KYC Policy
What the check asks for
Accepted documents, KYC levels, the KYC provider and source of funds checks.
Accepted documents
What documents does 500 Casino accept for KYC?
- Published
A photo of the ID card, front and back, and proof of address (bank statement, utility bill or government correspondence) no older than 6 months
Where a payment is flagged, an additional photo of the player holding the card used to pay may be required
KYC levels
What are the 500 Casino KYC levels?
- Mentioned, never specified
The help center refers to “KYC Tiers” and says extra verification tiers may be requested at any time, but publishes no tier table
Source: Help center
KYC provider
Which KYC provider does 500 Casino use?
- Published
SumSub, Chainalysis, AMLBot and SEON
Source: AML / KYC Policy
Source of funds
Does 500 Casino ask for source of funds?
- PublishedTerms of Service, “KYC/AML Policy”
The Terms let 500 Casino ask for documents that validate your source of funds as part of any KYC request. No threshold or document list for it is published.
Source: Terms of Service
While KYC is pending
What you can do while a check is pending, and how long it takes. Most casinos on this site publish no review time.
Limits during a check
What can you do at 500 Casino while KYC is pending?
- Published
500 Casino may restrict access to the Service until satisfactory compliance is achieved. Its documents don’t say what stays usable while a check is open
A restricted account shows a notice in the Account tab naming the cause: unverified e-mail, unverified Steam account, KYC limits or antifraud restrictions
Verification time
How long does 500 Casino KYC verification take?
- Not published
No verification review or approval time is published
Checked in: Help center: verification documents
If you fail or refuse
What happens if you don’t pass KYC, and what your account and wallet are screened against.
If you don’t verify
What happens if you fail or refuse KYC at 500 Casino?
- Published
You must send requested KYC documents within 7 calendar days. Miss the deadline and 500 Casino can suspend the account completely
Where verification can’t be completed, including when documents miss the 7-day deadline, the Terms say access to the Service “may be suspended immediately”.
Source: Terms of Service
Sanctions, PEP and wallet screening
What does 500 Casino screen your account and wallet against?
- Published
The AML policy lists 31 sanctions and PEP watchlists screened by third-party providers, including OFAC SDN, EU, UK HMT, UN and INTERPOL lists
The Terms add that your data is screened against sanctions and PEP lists, and every crypto transaction goes through blockchain analytics before it’s processed. A transaction linked to a sanctioned or high-risk address can be rejected and the funds frozen. Suspicious activity is reported to the Curaçao Financial Intelligence Unit.
Source: AML / KYC Policy
Age and document retention
The minimum age, and how long the casino keeps your documents.
Minimum age
How old do you have to be to play at 500 Casino?
- Published
18, or the age of majority under applicable law (Terms of Use)
Source: Terms of Service
Document retention
How long does 500 Casino keep your documents?
- Published
Records are retained for a minimum of 5 calendar years
Source: AML / KYC Policy
500 Casino KYC sources: every document behind this tab
6 documents, checked on October 4, 2026. Any of them can change without notice.
- Terms of Servicehttps://500.casino/en/terms-of-service
- AML / KYC Policyhttps://500.casino/en/aml-kyc-policy
- Help center: verification documentshttps://help.500.casino/en/articles/5925102-what-documents-are-required-for-account-verification
- Help center: account restrictionshttps://help.500.casino/en/articles/5925091-how-can-i-remove-restrictions-on-my-account
- Homepage and FAQhttps://500.casino/
- Help centerhttps://help.500.casino/en/
- 5
- 0
- 1
- 0
The six core questions: what the terms require, when KYC is triggered, accepted documents, limits during a check, verification time and what happens if you don’t verify. “Not published” means 500 Casino says nothing. “Not checked by us” is our gap.
500 Casino KYC vs other casinos: how its rules compare
500 Casino answers 5 of the 6 core questions. Across the 24 casinos with a KYC tab, the range is 4 to 6. Each card shows how every casino answers one question, and every name links to that casino’s KYC tab.
What the terms require
All 24 answer this. A casino gets this tab only if it does.
When KYC is triggered
All 24 answer this. A casino gets this tab only if it does.
Accepted documents
23 of the 24 publish an answer.
“Not checked by us” is our gap, and it never counts against a casino.
500 Casino KYC in the full comparison: every casino’s claim next to its terms
One table puts every casino’s KYC claim next to its terms and its triggers. It uses the same records as this tab.
No-KYC claims
Which casinos say “no KYC”, and what do their own terms require?
Every no-KYC claim, quoted and linked, next to the KYC rules in the same casino’s own terms.
Open the full comparison →500 Casino license: Terms and certificate name the CGA, the footer and AML policy don’t
500 Casino’s certificate, on cert.gcb.cw behind the link in its footer, matches the Terms on license number OGL/2024/1354/0882, Perfect Storm B.V. and company number 150536. It was granted December 16, 2024 and read Active on October 4, 2026. Since the September 24, 2026 rewrite, the Terms name the Curaçao Gaming Authority, as the certificate does. The footer still says Gaming Control Board, the authority’s old name, and the AML policy names Antillephone.
- October 4, 2026
- 5
- Checked at the regulator · Curaçao
- 6 of 6 core questions
A license record shows that the licensing relationship was on the regulator’s own record on the day we checked. It says nothing about a casino’s reserves, whether a withdrawal gets paid, how a dispute would end or whether playing is lawful where you live.
We haven’t contacted any regulator or filed a complaint. Every value is the record as it stood on the day we checked, linked so you can check it yourself. Registers and footers can change without notice.
500 Casino license FAQ: what people ask, answered up front
Quick answers from the regulator’s record and 500 Casino’s own documents.
Is 500 Casino’s license number on the Curaçao certificate?
Yes. The certificate at cert.gcb.cw, linked from 500 Casino’s footer, names 500.casino, Perfect Storm B.V., company number 150536 and license OGL/2024/1354/0882, the same values the Terms print. It was granted December 16, 2024.
See the row it came from →Is 500 Casino regulated by the Curaçao Gaming Authority or the Gaming Control Board?
The Curaçao Gaming Authority, which used to be called the Gaming Control Board. The certificate and, since September 24, 2026, the Terms name the CGA, and the footer still uses the old name. The AML policy, dated 2023, names Antillephone.
See every reading →Does the 500 Casino certificate say when the license expires?
No. It shows a grant date, December 16, 2024, and a status word, with no expiry date you can resolve. The XCM compliance validator in the footer names Perfect Storm B.V. and 500.casino and reports operating status VALID.
See the row it came from →
500 Casino license: how it was checked, the number and the holder
The certificate for OGL/2024/1354/0882 was retrieved from cert.gcb.cw on Sep 9, 2026 and again on Oct 4, 2026, from the link 500 Casino embeds in its own footer. It names 500.casino, Perfect Storm B.V. and company number 150536, matching 500 Casino’s own documents.
OGL/2024/1354/0882, returned by the certificate and printed identically in 500 Casino’s Terms and footer.
On the certificate: Perfect Storm B.V. · Curaçao company number 150536. In 500 Casino’s own documents: Perfect Storm B.V · Curaçao registration number 150536.
Checked at the regulator: Checked on the regulator’s own certificate, public register or seal validator. The number, holder and dates shown are the regulator’s, not the casino’s. Checking a Curaçao license: Certificates come from two hosts, cert.cga.cw and cert.gcb.cw, on a portal branded Curaçao Gaming Authority. Several certificates still name the Curaçao Gaming Control Board. A separate PDF license registry, published periodically, has a status column that varies between licensees.
500 Casino license record: every field, row by row
Every field on 500 Casino’s license record, marked regulator or casino, with its source.
How the license was checked
The regulator record we checked, and what the license seal on the casino’s site shows.
Checked at the regulator
Where was 500 Casino’s license checked?
- Checked at regulator
The certificate for OGL/2024/1354/0882 was retrieved from cert.gcb.cw on Sep 9, 2026 and again on Oct 4, 2026, from the link 500 Casino embeds in its own footer. It names 500.casino, Perfect Storm B.V. and company number 150536, matching 500 Casino’s own documents.
Records checked: Curaçao certificate, cert.gcb.cw · XCM compliance validator.
License seal
What does 500 Casino’s license seal or validator show?
- Checked at regulator
The XCM validator names Perfect Storm B.V., Korporaalweg 10, Willemstad, Curaçao, registered websites www.500.casino and 500.casino, and reports “Operating status: VALID”.
Perfect Storm B.V. is under compliance management of Xecutive Corporate Management B.V. (XCM), per the XCM validator
Source: XCM compliance validator
License number and holder
The license number and company the casino prints, checked against the regulator’s record.
License number match
Does 500 Casino’s license number match the regulator’s record?
- Checked at regulator
OGL/2024/1354/0882, returned by the certificate and printed identically in 500 Casino’s Terms and footer.
The certificate shows the same number as the footer, for the same company and company number.
Source: Curaçao license certificate (cert.gcb.cw) and Terms of Service
License holder
Who holds 500 Casino’s license?
- Checked at regulatorTerms of Service, opening and closing statements, repeated in the site footer
On the certificate: Perfect Storm B.V. · Curaçao company number 150536. In 500 Casino’s own documents: Perfect Storm B.V · Curaçao registration number 150536.
Source: Curaçao license certificate (cert.gcb.cw) and Terms of Service
Dates, domains and type
Issue and expiry dates, licensed domains and license type, as the record shows them. A date on a register isn’t a ruling on the license.
Issue and expiry dates
When does 500 Casino’s license expire?
- Checked at regulator
Granted December 16, 2024, per the Curaçao certificate. The certificate shows a grant date and no clear expiry date.
Status printed on the certificate: Active when checked on Oct 4, 2026.
Licensed domains
Which domains does 500 Casino’s license cover?
- Checked at regulator
500.casino, the one domain the certificate names.
The XCM validator names Perfect Storm B.V., Korporaalweg 10, Willemstad, Curaçao, registered websites www.500.casino and 500.casino, and reports “Operating status: VALID”.
License type
What type of license does 500 Casino hold?
- Checked at regulator
Games of chance under the National Ordinance on Games of Chance
Licensing authority
Who issued the license and under which law, and whether the casino’s documents agree.
Licensing authority
Who issued 500 Casino’s license?
- Two answers
The certificate names the Curaçao Gaming Authority, under the National Ordinance on Games of Chance (Landsverordening op de kansspelen, P.B. 2024, no. 157).
Casino documentThe other reading: The site footer still says “licensed by the Curaçao Gaming Control Board”
Since the Sep 24, 2026 rewrite, the Terms of Service say Perfect Storm B.V. “is licensed and regulated by the Curaçao Gaming Authority (CGA)”, as the certificate does. The AML/KYC Policy, last updated Wed Dec 13 2023, says “The Company’s Supervisory Gaming Authority is Antillephone”. The regulator’s own site says the Gaming Control Board is now called the Curaçao Gaming Authority, so the footer uses the old name for the same body. Antillephone N.V. was a master-license sub-licensor under the pre-2024 Curaçao regime, not the authority named on the 2024 certificate. The AML policy predates the license it would have to describe.
The certificate is served from cert.gcb.cw (the Gaming Control Board hostname), while the page itself is branded “CGA Portal” and signed “Copyright 2026 Curaçao Gaming Authority”.
Source: Curaçao license certificate (cert.gcb.cw) and Site footer
500 Casino license: one disagreement on the record
Each card sets one record against another and labels where each reading came from. Where a casino footer and a register differ, the register is the one you can check.
The Terms, the footer and the AML policy name three different supervisors for one license.
- Regulator record
Curaçao certificate, cert.gcb.cw
The certificate names the Curaçao Gaming Authority
- Casino document
Terms of Service, rewritten Sep 24, 2026
Since the Sep 24, 2026 rewrite, the Terms of Service say Perfect Storm B.V. “is licensed and regulated by the Curaçao Gaming Authority (CGA)”, as the certificate does
- Casino document
Site footer
The site footer still says “licensed by the Curaçao Gaming Control Board”
- Casino document
AML/KYC Policy
The AML/KYC Policy, last updated Wed Dec 13 2023, says “The Company’s Supervisory Gaming Authority is Antillephone”
Why they differ: The regulator’s own site says the Gaming Control Board is now called the Curaçao Gaming Authority, so the footer uses the old name for the same body. Antillephone N.V. was a master-license sub-licensor under the pre-2024 Curaçao regime, not the authority named on the 2024 certificate. The AML policy predates the license it would have to describe.
500 Casino license check: what we asked for and didn’t get
Regulator pages that blocked us, timed out or gave the same answer for any domain. A blocked page says nothing about the licensee.
- Our check
500.casino over a plain HTTP client
500.casino and help.500.casino answer plain HTTP clients with HTTP 403 and a Cloudflare challenge document titled “Enable JavaScript and cookies to continue”. Both were read in a real browser instead. Only https://500.casino/robots.txt returned 200 to a direct request.
What this means: We read 500 Casino’s documents in a real browser instead. The certificate and the compliance validator came straight from their own hosts and are unaffected.
500 Casino license research notes: what we checked and what we still don’t know
Our own notes, not the regulator’s or the casino’s statements.
The AML policy predates the license it describes
The AML/KYC Policy, last updated Wed Dec 13 2023, says “The Company’s Supervisory Gaming Authority is Antillephone”. The regulator’s own site says the Gaming Control Board is now called the Curaçao Gaming Authority, so the footer uses the old name for the same body. Antillephone N.V. was a master-license sub-licensor under the pre-2024 Curaçao regime, not the authority named on the 2024 certificate. The AML policy predates the license it would have to describe.
An RNG certificate is not a license
iTech Labs certified the Perfect Storm B.V. RNG on December 23, 2024, with scaling tests for Wheel of Fortune, Roulette, Duels, Crash, Plinko, Towers, Dice, Cases and Mines, against the UK Remote Gambling and Software Technical Standards February 2021. The RNG certificate covers the nine in-house instant games it names. It says nothing about third-party slot or live-casino titles, and it is not a license.
500 Casino license sources: every record behind this tab
5 documents: regulator records first, then 500 Casino’s own. Registers and footers can change without notice.
- Curaçao license certificate (cert.gcb.cw)https://cert.gcb.cw/certificate?id=ZXlKcGRpSTZJa2xLU2xwbk56VlVOR3RVVjBGdFJGUkthRzkwUkdjOVBTSXNJblpoYkhWbElqb2lTR2xwWVVKRlkwWkNZbkE1UkdSbFNqRk9ZMmh2UVQwOUlpd2liV0ZqSWpvaU9ESmlNMlJsTUdJd05ETTJNemhtWm1Fd05EUmlPR05rTmpRM1lUazRNV1U1WWpBek5UbG1ZVFJoTnprMVlqWmlORGhqWmpKak9XSmtNak14TTJVeU9TSXNJblJoWnlJNklpSjk=
- Terms of Servicehttps://500.casino/en/terms-of-service
- Site footerhttps://500.casino/
- XCM compliance validatorhttps://validator-xcm.certria.com/validate?domain=500.casino&seal_id=a26d86676a364092be8bc4a33d04df01157b3570f634471e2d9250d19d8f5ba3fe2f41a6b71c73766ca45c4b0b3f745e&stamp=882a96c58326012bf598a93ffdd98ce2
- AML / KYC Policyhttps://500.casino/en/aml-kyc-policy
- 6
- 0
- 0
- 0
The six core questions: how the license was checked, the number match, the holder, the dates, the domains and the authority. “Not published” means 500 Casino or its register says nothing. “Not checked by us” is our gap.
500 Casino license vs other casinos: how the record compares
500 Casino answers 6 of the 6 core questions. Across the 24 casinos with a license tab, the range is 5 to 6. Each card shows how every casino answers one question, and every name links to that casino’s license tab.
How the license was checked
All 24 answer this. A casino gets this tab only if it does.
License number match
All 24 answer this. A casino gets this tab only if it does.
License holder
All 24 answer this. A casino gets this tab only if it does.
“Not checked by us” is our gap, and it never counts against a casino.
500 Casino license in the full comparison: every license record next to its footer
One table shows every casino’s license number and holder next to the regulator’s record, grouped by regulator and never ranked. It uses the same records as this tab.
Licenses at the regulator
Is the license number in the footer the one the regulator holds?
License numbers as each casino prints them, checked against the regulator’s register or certificate, and what a license doesn’t prove.
Open the full comparison →500 Casino restricted countries: five layers, and a market it accepts can still lose NetEnt
500 Casino publishes four country lists in one clause, for the whole site, the mirror domains, the sportsbook and the casino games. A NetEnt list makes a fifth layer. On top of those, some games carry their own country rules, shown only as a grayed-out tile in the lobby and never listed. The September 24, 2026 rewrite added ten names to the mirrors list, the UK and the US among them.
- Documents checked October 4, 2026
- 3 sources cited
- 67 distinct territories named
- 7 of 8 core questions answered by 500 Casino
Every list here is the casino’s own, not legal advice. We don’t say whether online gambling is allowed where you live, and a country missing from a list isn’t permission. Casinos change these lists without notice.
We haven’t tried signing up from any country.
Don’t use a VPN, a mirror site or a fake address to get around a geo-block. Casinos that publish a penalty name a breach of terms, an account closed without notice or a forfeited balance.
500 Casino restricted countries FAQ: what people ask, answered up front
Quick answers from 500 Casino’s own restricted list and terms.
Why does 500 Casino publish four different country lists?
They block different things. Five territories lose the whole site under the gambling license, 29 lose the mirrors and main domains, four lose only the sportsbook and three only the casino games. You can be blocked on one layer and not another.
See the full list →What is the NetEnt layer on 500 Casino?
A studio annex in the same Terms lists 50 territories where NetEnt titles are unavailable, so a country 500 Casino accepts can still lose that studio’s games. The Terms also say “some Casino games have custom country restrictions”, and list none.
See the full list →How does 500 Casino decide where a player is?
By “your IP address and other factors”, it says, adding that the restrictions come from its license holders or local governments, not from 500 Casino itself. The Terms also require that you don’t live in a Restricted Territory.
See the row it came from →
500 Casino restricted countries: the list, whether it’s complete, and where else it appears
- Published
500 Casino doesn’t publish one restricted list. It publishes 4 in the same clause, and each blocks something different: the whole site, the mirror domains, the sportsbook or the casino games.
- Published
On top of the five layers, the Terms say “some Casino games have custom country restrictions”, shown only by graying out the game in the lobby. No list of those games is published.
- Published
The NetEnt tab of the Terms prints the same 50 territories, in the same order, as its “Blacklisted Territories”. It adds a 19-country “Absolute Restriction” list and extra blocks for five branded slots.
500 Casino restricted countries list: every territory it names
67 distinct names across 5 published lists, sorted A to Z so you can find yours. A filled dot means that document names the territory.
Whole site, under the gambling license
CasinoThe casino won’t take players from these territories. 5 entries, listed in Terms of Service.
As required under the conditions of our Curaçao gaming license, 500 Casino is not available in the United States and its territories, the Netherlands, and France. In addition, residents of Curaçao and the other Dutch Caribbean islands are not permitted to play, in accordance with the local-resident restrictions applicable under the LOK
Selected mirrors and main domains
CasinoThe casino won’t take players from these territories. 29 entries, listed in Terms of Service.
Selected mirrors and main domains are not available in the following countries
Sportsbook unavailable
CasinoThe casino won’t take players from these territories. 4 entries, listed in Terms of Service.
Sportsbook is not available altogether in these countries
Casino games unavailable
CasinoThe casino won’t take players from these territories. 3 entries, listed in Terms of Service.
Casino games are not available altogether in these countries
NetEnt titles unavailable
ProviderA game provider blocks its games here, even where the casino accepts players. 50 entries, listed in Terms of Service.
Reading the table: 500 Casino writes the United States three ways across its five layers (“United States and its territories”, “United States” and “United States of America”), so it takes three rows. Each name appears exactly as its layer prints it.
500 Casino restricted countries: every territory rule, row by row
Every 500 Casino restricted country rule, with its clause and source.
The restricted list
The restricted countries list, where else it appears and whether it’s complete.
Restricted countries
Which countries does 500 Casino block?
- PublishedTerms of Service, “Region Restrictions”
500 Casino doesn’t publish one restricted list. It publishes 4 in the same clause, and each blocks something different: the whole site, the mirror domains, the sportsbook or the casino games.
The Terms tab is dated Thu Sep 24 2026 (the date printed at the foot of the Terms of Service tab). The same page also prints “Last updated: Fri May 26 2023” above the tab strip, so the document carries two update dates. The rewrite of Sep 24, 2026 added ten names to the mirrors layer (Austria, Curaçao, France, Germany, the Netherlands, Norway, Spain, Sweden, the United Kingdom and the United States) and reworded the license layer. “Dutch West Indies and Curacao” became residents of Curaçao and the other Dutch Caribbean islands, under the local-resident rule of the LOK.
Source: Terms of Service
Second list
Does 500 Casino publish the same list anywhere else?
- Published
The NetEnt tab of the Terms prints the same 50 territories, in the same order, as its “Blacklisted Territories”. It adds a 19-country “Absolute Restriction” list and extra blocks for five branded slots.
The homepage FAQ prints no list of its own. It sends you to the Terms of Service page to check your country.
Source: Terms of Service, NetEnt tab
Whether the list is complete
Is 500 Casino’s restricted list complete?
- Published
On top of the five layers, the Terms say “some Casino games have custom country restrictions”, shown only by graying out the game in the lobby. No list of those games is published.
Source: Terms of Service
How far the block reaches
The license and the game providers can block countries the casino’s own list leaves out.
What the license covers
Does 500 Casino’s license restrict the same countries?
- Published
The Terms tie the first layer to the license: 500 Casino is closed there “as required under the conditions of our Curaçao gaming license”. The certificate itself names no territories.
Source: Terms of Service
NetEnt titles unavailable
Do game providers block countries 500 Casino accepts?
- Published
500 Casino also publishes a studio-level layer. NetEnt titles are unavailable in 50 territories, several of which the four site-wide layers never name.
Source: Terms of Service
What the rule covers
Whether the ban follows where you live or where you are, the VPN rules and how the casino checks your location.
Residence or location
Does 500 Casino’s ban follow where you live or where you are?
- Published
The Terms require that users are not residents of any of the Restricted Territories, at sign-up and for as long as the account is open.
Users must be recognized as adult by applicable law (18+ years old)
Source: Terms of Service
Using a VPN
Can you use a VPN at 500 Casino?
- Not published
No 500 Casino document mentions VPNs or proxies. The Terms say only that access is restricted “based on your IP address and other factors”.
Checked in: Terms of Service
How location is checked
How does 500 Casino check your location?
- Published
500 Casino says it restricts access “based on your IP address and other factors”, and that restrictions are imposed by its license holders or by local governments.
Source: Terms of Service
Playing from a restricted country
What happens to your account and balance, and what you see from a blocked country.
What happens to the account
What happens to your 500 Casino account if you play from a restricted country?
- Published
The Terms list use that “may cause violation of law or regulations” among the grounds for suspending or terminating an account “at any time and without notice”, and a suspension gives no right to compensation. They don’t say what happens to the balance in that case.
Source: Terms of Service
What a blocked player sees
What do you see at 500 Casino from a blocked country?
- Published
For a game with its own country block, the Terms say the game is grayed out in the lobby. No document says what a visitor from a fully restricted country sees.
Source: Terms of Service
Everywhere else
Any claim about where the casino is open, and who it says must check local law.
Where the casino says it’s open
Where does 500 Casino say it’s available?
- Published
The homepage FAQ answers “Is 500 Casino Available in My Country?” with “500 Casino is available to players in many countries around the world.” It adds that access may be restricted in certain regions and sends you to the Terms of Service.
Source: Homepage FAQ
Local law
Who does 500 Casino make responsible for local law?
- Published
The Terms make it your job to know the law where you live and to make sure using 500 Casino is lawful there. You accept at sign-up that the site runs on an international Curaçao license, not a local one.
Source: Terms of Service
500 Casino restricted countries research notes: what we checked and what we still don’t know
Our own notes, not the casino’s statements.
Ontario
Ontario is not named in any of the five layers. An iGaming Ontario registration was not found.
500 Casino restricted-country sources: every document behind this tab
3 documents, checked on October 4, 2026. Any of them can change without notice.
- Terms of Servicehttps://500.casino/en/terms-of-service
- Terms of Service, NetEnt tabhttps://500.casino/terms-of-service/netent
- Homepage FAQhttps://500.casino/
- 7
- 0
- 1
- 0
The eight core questions: the list, a second list, whether it’s complete, what the license covers, game provider blocks, what happens to the account, VPN rules and location checks. “Not published” means 500 Casino says nothing. “Not checked by us” is our gap.
500 Casino restricted countries vs other casinos: how its lists compare
500 Casino answers 7 of the 8 core questions. Across the 22 casinos with a countries tab, the range is 4 to 8. Each card shows how every casino answers one question, and every name links to that casino’s countries tab. 500 Casino names 67 distinct territories, the third longest list of the 22. The lists run from 9 to 85 names. A longer list means a more detailed document, not a stricter casino.
Restricted countries
All 22 answer this. A casino gets this tab only if it does.
Second list
17 of the 22 publish an answer.
Whether the list is complete
21 of the 22 publish an answer.
“Not checked by us” is our gap, and it never counts against a casino.
500 Casino complaints: a written answer within 4 weeks, then Resolvo at no cost to you
500 Casino takes complaints by live chat or at support@500.casino, around the clock, and a formal one on its complaint form. It confirms receipt within a week and answers within 4 weeks, or 2 and 5 business days for a responsible gambling complaint. After that you can take it to Resolvo, a CGA-certified ADR provider, for free, and its decision binds 500 Casino. Self-exclusion is set from profile settings, can’t be lifted and has no published length.
- Documents checked October 4, 2026
- 9 sources cited
- Regulator route checked
- 6 of 6 core questions answered by 500 Casino
Where the regulator describes a different route from the casino, the regulator’s route is the one you’d have to use. This is the casino’s published route, not legal advice.
Our support-chat tests are coming soon. We haven’t filed a complaint or used a self-exclusion tool at any casino. Each rule is dated and linked to its source, and casinos can change them without notice.
500 Casino complaints FAQ: what people ask, answered up front
Quick answers from 500 Casino’s own documents and its regulator.
Does 500 Casino have a complaint form?
Yes. The Official Complaint Submission Form is on 500.casino/complaints, online or as a PDF you email to support@500.casino. You can file it free up to 6 months after the bet or incident, and 500 Casino confirms receipt within a week.
See the row it came from →Who hears a 500 Casino dispute after support?
Resolvo, a CGA-certified ADR provider in Curaçao. You can go there after 500 Casino’s final answer or a missed deadline. It’s free, it rules within 90 days, and its decision binds 500 Casino but not you.
See the row it came from →Will the Curaçao Gaming Authority hear a 500 Casino complaint?
Not as a dispute. The CGA says it doesn’t handle individual complaints, though you can report a license breach to it. Its own pages give complaints@cga.cw, and 500 Casino’s policy gives playercomplaints@cga.cw.
See the row it came from →How long can you self-exclude from 500 Casino?
500 Casino doesn’t say. The responsible gaming page and the help center both give only “a predetermined amount of time”. You set it from profile settings, it isn’t lifted even if you ask, and you can still withdraw your balance during it.
See the self-exclusion rules →
500 Casino complaint route: where it starts, where it goes, and who is named
- Published
Live chat, or support@500.casino
- Published
A senior complaints manager reviews a complaint the first handler can’t resolve. After the final answer, or a missed deadline, you can take it to Resolvo, the ADR provider 500 Casino designates, free of charge.
- Published
Resolvo, a CGA-certified ADR provider at Hydraweg 3, Curaçao (www.resolvocuracao.com, info@resolvocuracao.com, +599 9675 3176), named in the Terms and the Complaints Policy.
500 Casino complaint and self-exclusion terms: every rule, row by row
Every 500 Casino complaint and self-exclusion rule, with its clause and source.
Complaining to the casino
Where to complain, the deadlines on both sides, the complaints clause, the form and who settles a disputed bet.
Where a complaint starts
How do you file a complaint with 500 Casino?
- Published
Live chat, or support@500.casino
Support is stated to be available 24/7/365. A formal complaint goes on the Official Complaint Submission Form, filled in online at 500.casino/complaints or as a PDF emailed to support@500.casino. Post to Korporaalweg 10, Willemstad, Curaçao also works.
Source: Complaints Policy
Complaint deadlines
What are the 500 Casino complaint deadlines?
- Published
Written acknowledgment within 1 week and a reasoned answer within 4 weeks, which can be extended once by 4 more weeks with written notice. A responsible gambling complaint gets 2 business days and 5 business days.
You can complain free of charge up to 6 months after the bet settled or the incident happened. A later complaint is considered at 500 Casino’s discretion.
Source: Complaints Policy
Complaints clause
Which 500 Casino terms clause covers complaints?
- Published
Terms of Service, “Limitations of Liability and Complaints”, and the Complaints Policy, last updated Wed Sep 23 2026
Source: Terms of Service
Complaint form
Does 500 Casino have a complaint form?
- Published
The Official Complaint Submission Form, a two-page PDF linked from 500.casino/complaints. It asks for your name, address, account, both dates, a category, what happened and the outcome you want.
Who decides a disputed bet
Who settles a disputed bet at 500 Casino?
- Published
In a dispute, the information recorded by 500 Casino or by the game provider is stated to be the deciding factor
500 Casino states it is “not in any way required to grant refunds or compensation for any issue whatsoever” and that all bets are final. It will not credit wins on rejected bets for any reason, including user limits, rounding, provider errors or latency
Source: Terms of Service
Message retention
How long does 500 Casino keep your support messages?
- Published
The AML/KYC Policy keeps “Conversational history” with your other records for a minimum of 5 calendar years. The Privacy Policy says chat transcripts and emails are collected.
Source: AML / KYC Policy
Escalating past the casino
The escalation route, the ADR body, the regulator, and the law and courts the terms pick. Those courts are often not in the country that issued the license.
Escalation route
Where can you escalate 500 Casino complaints?
- Published
A senior complaints manager reviews a complaint the first handler can’t resolve. After the final answer, or a missed deadline, you can take it to Resolvo, the ADR provider 500 Casino designates, free of charge.
“These Terms are governed by and construed in accordance with the laws of Curaçao.” A dispute the complaint and ADR steps can’t settle goes to the competent courts of Curaçao
Source: Complaints Policy
Named ADR body
Does 500 Casino name an ADR body?
- Published
Resolvo, a CGA-certified ADR provider at Hydraweg 3, Curaçao (www.resolvocuracao.com, info@resolvocuracao.com, +599 9675 3176), named in the Terms and the Complaints Policy.
Resolvo is free for you, and 500 Casino pays every cost. It acknowledges a referral within 7 calendar days and issues a written outcome within 90 days. The outcome binds 500 Casino, not you, and a finished ADR case can’t be restarted with another provider.
Source: Complaints Policy
What the regulator says
Can you complain to 500 Casino’s regulator?
- Published
The Curaçao Gaming Authority’s own online-gaming page states that “the CGA does not handle individual complaints against gaming providers” and that resolving disputes between players and operators “is not within our mandate”. It takes complaints at complaints@cga.cw as signs of possible breaches of the law.
The Complaints Policy says the CGA isn’t a stage of the procedure. You can tell it at any time that 500 Casino breached its license, at portal.cga.cw or playercomplaints@cga.cw, and 500 Casino promises to cooperate. The CGA’s own pages give complaints@cga.cw. The Complaints Policy and the complaint form give playercomplaints@cga.cw and portal.cga.cw.
Governing law and courts
Which law and courts govern 500 Casino’s terms?
- Published
“These Terms are governed by and construed in accordance with the laws of Curaçao.” A dispute the complaint and ADR steps can’t settle goes to the competent courts of Curaçao
Source: Terms of Service
Class actions and jury trial
Do 500 Casino’s terms waive class actions or jury trials?
- Not published
The Terms waive neither class actions nor jury trials. The ADR outcome doesn’t bind you, and the courts of Curaçao stay open to you.
Checked in: Terms of Service
Self-exclusion and limits
Self-exclusion, deposit limits, cool-offs, account closure and inactive accounts.
Self-exclusion
How do you self-exclude at 500 Casino?
- Published
Yes, activated by the player from profile settings. Exclusion length: Not published. The responsible gaming page and the help center both say only “a predetermined amount of time”, and name no length, minimum or maximum.
Support will also restrict access on request, per the responsible gaming page. The responsible gaming page advises players to “set yourself reasonable limits” but offers no tool that enforces one. Self-exclusion is the only published control.
Periods, waiting period and balance rules are in the self-exclusion table below.
Source: Help center: self-exclusion
Deposit, loss and wager limits
Can you set deposit limits at 500 Casino?
- Not published
The responsible gaming page advises players to “set yourself reasonable limits” but offers no tool that enforces one. Self-exclusion is the only published control.
500 Casino also reserves the right to limit a player’s bet sizes or game access “in order to mitigate potential losses and remain profitable”. It says the system may enforce automatic limits from playing patterns. That is a house control, not a player control.
Checked in: Responsible gaming page
Time-out or cool-off
Does 500 Casino offer a cool-off or time-out?
- Not published
No time-out or cool-off tool is published. The responsible gaming page offers self-exclusion and nothing shorter, and the Complaints Policy names cooling-off only as a kind of complaint you can make.
Checked in: Responsible gaming page
Account closure
How do you close your 500 Casino account?
- Two answers
By email to support@500.casino. Personal data is deleted, but identifying information is kept a minimum of 5 years under the AML policy. The action is irreversible and loses all rewards, level and XP.
The other document: The Privacy Policy, last updated Wed Sep 23 2026, says you can ask for deletion “by contacting Live Support or emailing support@500.casino”.
The Terms and the help center say live chat can’t start an account deletion. The Privacy Policy lists Live Support as one of the two ways to ask for it.
Account deletion can’t be started in live chat. It must go by email to support@500.casino
Source: Help center: can I delete my account and Privacy Policy
Inactive accounts
What happens to an inactive 500 Casino account?
- Published
An account not accessed for over four years can be closed. Before any balance is forfeited, 500 Casino says it will try to reach you by email with at least 30 days’ notice to reclaim it, and you can reclaim it until the legal limitation period runs out.
Source: Terms of Service
Dormancy fee
Does 500 Casino charge a dormancy fee?
- Not published
No dormancy or inactivity fee appears in the Terms. A dormant account is closed, not charged.
Checked in: Terms of Service
Gambling help links
Which gambling help groups does 500 Casino link to?
- Published
GamCare (www.gamcare.org.uk, helpline 0845 6000 133), Gamblers Anonymous (www.gamblersanonymous.org.uk) and Gambling Therapy (www.gamblingtherapy.org)
Parental tools named: Net Nanny, GamBlock, CyberSitter. The responsible gaming page publishes a 13-question self-assessment checklist, including one on suicidal thoughts.
Source: Responsible gaming page
500 Casino complaints and self-exclusion: one rule has two published answers
Both readings come from 500 Casino, checked the same day. Follow one document’s route and you can be refused under the other’s rule.
Account closure
By email to support@500.casino. Personal data is deleted, but identifying information is kept a minimum of 5 years under the AML policy. The action is irreversible and loses all rewards, level and XP.
Source: Help center: can I delete my account
The Privacy Policy, last updated Wed Sep 23 2026, says you can ask for deletion “by contacting Live Support or emailing support@500.casino”.
The Terms and the help center say live chat can’t start an account deletion. The Privacy Policy lists Live Support as one of the two ways to ask for it.
500 Casino self-exclusion: as its document states it
500 Casino’s self-exclusion rules in its own words or a close paraphrase, checked on October 4, 2026.
Yes, activated by the player from profile settings. Exclusion length: Not published. The responsible gaming page and the help center both say only “a predetermined amount of time”, and name no length, minimum or maximum.
Support will also restrict access on request, per the responsible gaming page. The responsible gaming page advises players to “set yourself reasonable limits” but offers no tool that enforces one. Self-exclusion is the only published control.
Source: Help center: self-exclusion
A cell that says a rule isn’t published is about 500 Casino. “Not recorded by us” is our gap. The criteria shortlist checks every casino for self-service self-exclusion with a published period, from these same documents.
500 Casino complaints research notes: what we checked and what we still don’t know
Our own notes, not the casino’s statements.
The validator’s ADR line still goes nowhere
The XCM compliance validator linked from 500 Casino’s footer still carries the sentence “Please refer to if you can document that you have exhausted all complaint procedures of the website without satisfactory resolve.” The destination is missing from the sentence, and the only anchor on that line resolves to href="#". Read again on Oct 4, 2026.
Disputes between players
500 Casino states it will not intervene in or settle disputes between players over P2P trades
500 Casino complaints sources: every document behind this tab
9 documents, checked on October 4, 2026. Any of them can change without notice.
- Complaints Policyhttps://500.casino/complaints
- Curaçao Gaming Authority: online gaminghttps://www.cga.cw/regulation/online-gaming
- Help center: self-exclusionhttps://help.500.casino/en/articles/5925078-can-i-remove-my-self-exclusion
- Terms of Servicehttps://500.casino/en/terms-of-service
- Official Complaint Submission Form (PDF)https://cdnv1.500.casino/docs/Perfect+Storm+B.V.+-+complaints+submission+form.pdf
- AML / KYC Policyhttps://500.casino/en/aml-kyc-policy
- Responsible gaming pagehttps://500.casino/en/responsible-gaming
- Help center: can I delete my accounthttps://help.500.casino/en/articles/5925075-can-i-delete-my-account
- Privacy Policyhttps://500.casino/privacy-policy
- 6
- 0
- 0
- 0
The six core questions: where a complaint starts, the escalation route, the deadlines, the ADR body, what the regulator says and how self-exclusion works. “Not published” means 500 Casino says nothing. “Not checked by us” is our gap.
500 Casino complaints compared: how its route stacks up
500 Casino answers 6 of the 6 core questions. Across the 24 casinos with a complaints tab, the range is 3 to 6. Each card shows how every casino answers one question, and every name links to that casino’s complaints tab.
Where a complaint starts
All 24 answer this. A casino gets this tab only if it does.
Escalation route
15 of the 24 publish an answer.
Named ADR body
5 of the 24 publish an answer.
“Not checked by us” is our gap, and it never counts against a casino.
500 Casino self-exclusion compared: every casino scored the same way
The shortlist checks every casino against the same six published terms, including self-service self-exclusion for a published period. It uses the same research as this tab.
Criteria shortlist
Which crypto casinos meet every published term we can check?
Every casino we cover, checked against the same published terms and grouped by how many it meets, A to Z in each group. A shortlist, not a ranking.
Open the criteria shortlist →500 Casino bet data: bets flagged High Wins or Lucky Wins are 3.63% of the feed and 119.82% of player net
We counted every figure on this tab from the bets 500 Casino’s public feed showed in this window. None of it comes from 500 Casino itself.
- 535,615
- 168
- Sep 16–23, 2026
- $51.8M
- 117.64%
- Payout ÷ stake in this feed
- $9.1M
About the 500 Casino feed
- Source: All Bets feed. Casino, originals and sportsbook bets.
- Sportsbook bets count as the feed reports them, and their final settlement is not confirmed.
500 Casino bet data: key findings
37.85% / 59.90%
500 Casino player net by product
Third-party casino games took 320,857 bets, with a player net of −$10.34M. House Originals took 202,720 bets, with a player net of +$14.72M.
Product labels come from the feed and don’t list every game.
19,443
500 Casino’s own win flags mark the bets that move the total
Those bets paid $13.19M on $2.25M staked.
The casino decides which bets get the flags.
2,631
The 500 Casino feed spans casino games and sportsbook events
The feed shows 2,567 sportsbook event labels next to 2,631 casino titles and 12 house titles.
Titles come and go, and the feed can’t show which ones your country gets.
500 Casino payout ratio: 117.64% of stake paid back
500 Casino players won $9.1M on the bets we captured.
117.64%
Payout ÷ stake across 535,615 priced bets (100.0% of the feed). It’s a feed ratio, not a game’s RTP.
- Stake captured$51.8M
- Paid back$60.9M
Where 500 Casino ranks: #3 of 15 on largest player net
- #5Best payout ratio$60,899,642.24 paid out on $51,768,356.30 staked117.64%
- #4Highest volume$51,768,356.30 staked in 168 hours$308.14K/hr
- #12Most active feeds535,615 bets in 168 hours3.19K/hr
- #3Largest player netPlayers finished $9,131,285.94 up+$9.13M
- #4Average bet$51,768,356.30 staked over 535,615 bets$96.65
Biggest 500 Casino wins in the public feed
The top multiplier in this window was 9,900× on Dice.
Highest multipliers in this capture window. Amounts are as the feed priced them.
500 Casino bet sizes: half of all bets under $6.67
The largest 1% of 500 Casino bets carried 53.0% of all stake.
500 Casino bet size percentiles
- 10% of bets under$0.48
- 25% under$2.12
- Half under$6.67
- 75% under$18.69
- 90% under$97.25
- 99% under$1,666.00
Bets by stake size
- < $0.100.0%0.0% of stake
- $0.10–$114.7%0.1% of stake
- $1–$1047.9%2.3% of stake
- $10–$10027.8%9.0% of stake
- $100–$1,0007.9%26.7% of stake
- $1,000–$10,0001.6%40.8% of stake
- ≥ $10,0000.1%21.1% of stake
500 Casino win rate: 80.8% of bets paid something
- Paid back at least the stake (≥ 1×)41.4%
- Doubled the stake (≥ 2×)23.6%
- ≥ 10×2.3%
- ≥ 100×0.080%
- ≥ 1,000×0.000%
The median paying bet returned 1.01× its stake.
Most played games at 500 Casino: Plinko leads
Plinko took 9.0% of all 500 Casino bets in this window.
500 Casino currencies: USD on 100.0% of bets
- USD100.0%100.0% of stake
When 500 Casino is busiest: Thu 22:00 UTC
Quietest hour: Fri 05:00 UTC. Busiest hours at every casino
500 Casino bet data since Jul 12, 2026: 4,919,441 bets
- Jul 12, 2026
- Sep 23, 2026
- 4,919,441
- 1,558
- 88.4%
- Plinko (house)
How we captured the 500 Casino bet data
Our collector reads 500 Casino’s public bet feed, the live bets list on its own site. It stores every bet with the time we captured it. This tab covers the last seven days of capture, or the whole capture if it ran shorter. A public feed isn’t 500 Casino’s full record, and our capture has gaps. Every figure here describes what the feed showed. How to read the data